
May 3, 2016 | Articles, DataPoint, DataPoint Automation, Financial, Marketing and Advertising
When you think of Business Intelligence (BI) reporting tools, PowerPoint might not come to mind. Here are some great reasons why PowerPoint deserves to be in your kit of BI reporting tools. Ease of Use Data Connections Dashboarding Total Customization Add-Ons Ease of...
Apr 26, 2016 | DataPoint, DataPoint Real-time Screens
Our DataPoint add-on for PowerPoint allows you to connect your presentation to a JSON file or data source, and then display this JSON information in real-time on your information screen or in your PowerPoint reports. JSON or JavaScript Object Notation is a lightweight...

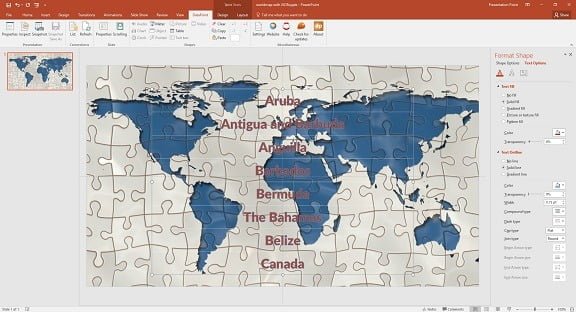
Apr 19, 2016 | DataPoint, DataPoint Real-time Screens, How-To, Maps
Today we released a new version of our DataPoint product. Next to images, text boxes, charts, tables, … that you can link to dynamic information for real-time content, we have added something revolutionary; dynamic pointers on your slides. You can now display...
Apr 12, 2016 | DataPoint, DataPoint Real-time Screens, How-To
When you use our DataPoint technology to display real-time information on your PowerPoint slides, then you are displaying dynamic information from a data source. Typical for dynamic values, is that you have no real control over the minimum or maximum length of the...
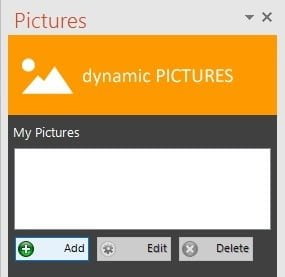
Apr 5, 2016 | Articles, DataPoint
Today’s article will show you how you can insert images or pictures on your PowerPoint slides. Basically there are 3 ways to display images on a PowerPoint slide: a single picture in a picture box or a background image on your slide or, and this is special, a...

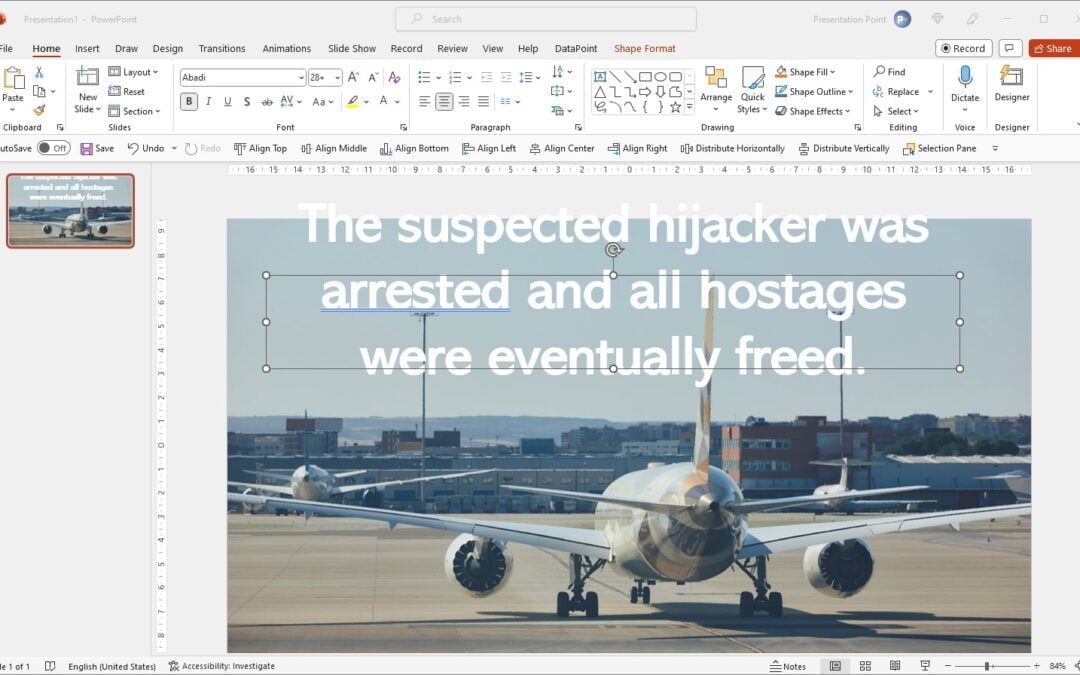
Mar 30, 2016 | DataPoint, DataPoint Real-time Screens, Marketing and Advertising
Terrorist attacks, disasters, shootings and so on, keeps us tied to the news and we watch as many news channels as possible. News papers, news websites, Facebook, Twitter, radio and so on. With the recent terrorist attacks, we probably all have the same behaviour. We...

Mar 28, 2016 | Articles, DataPoint, DataPoint Real-time Screens
We’ve all been there. Sitting in a darkened room, watching a boring presentation with a speaker with a droning voice, reading bullet point after bullet point of largely data. ZZZZZZZZ. Instead of the usual boring PowerPoint presentations, why not give dynamic...
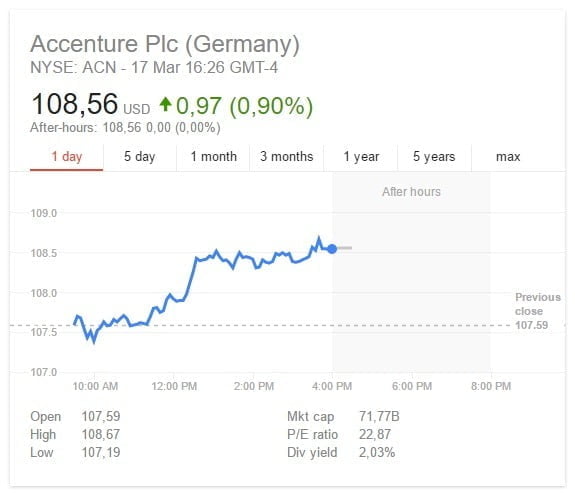
Mar 24, 2016 | DataPoint, DataPoint Real-time Screens, Financial
Stock Quotes Data Sources In today’s article we will show you, how you can create a real-time information screen for your company, where you display real-time stock quotes information on your monitor. DataPoint technology is used here, as a PowerPoint add-on, to...

Mar 17, 2016 | Articles, DataPoint, DataPoint Real-time Screens, Healthcare
Committed to flexibility and adding value, PresentationPoint has drawn from the field of a data science to imitate and develop accurate data analysis using digital signage, to transform the way we look at health at the individual and global level! It is true that the...
Mar 9, 2016 | DataPoint
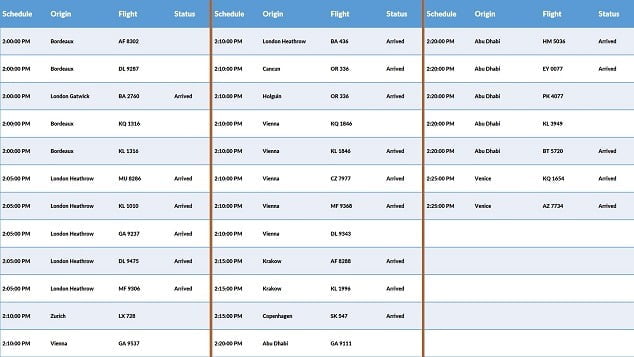
We all know the places where you have such information screens displaying a list. Look at flight information at an airport, departing trains at a station, job listings, movies in a cinema, exhibitions etc. They are all look similar. At the first row you will find some...
Mar 3, 2016 | DataPoint, DataPoint Automation, How-To
Generate Presentations with the Task SchedulerDataPoint is the tool to update your slide content automatically. With this PowerPoint add-on, you can link your slides to any data source for up-to-date presentations. And PowerPoint is great for presenting information....
Feb 12, 2016 | DataPoint, DataPoint Real-time Screens
Real-time data on your information screen is hot to look at, and not that difficult to produce. The most used tool to create presentations, Microsoft PowerPoint, in combination with the DataPoint add-on, brings real-time data to your slides or slideshows. You can...

Feb 10, 2016 | DataPoint, DataPoint Real-time Screens, How-To
What are Text Tickers? It probably started on television. Display text or graphical information on your television channel, on top of the broadcast. Often it is used as a text ticker for special events, interruptions, news messages and announcements. The advantage of...

Jan 29, 2016 | DataPoint
A new feature is upcoming for DataPoint. DataPoint is used to link PowerPoint shapes to data sources like databases, XML files, RSS feeds, Excel data sheets etc. In that way, you always have the latest information on your slides. You can link the content of a data...
Jan 25, 2016 | DataPoint, DataPoint Real-time Screens, How-To
Today, you will learn a great trick for a PowerPoint presentation. You can make your PowerPoint presentations completely dynamic. Watch how you can connect a PowerPoint text box to a data source and use text boxes as dynamic text boxes on your slides. Set Up a Data...

Jan 21, 2016 | DataPoint
Hyperlinks in PowerPoint presentations can be great when you have presentations with links to other documents, presentations, external files or websites. On a slide, you can give some minimal information and invite people to click for a more...

Jan 14, 2016 | DataPoint, DataPoint Real-time Screens
Learn how to use DataPoint technology to show live XML data on your slides. You will see how to connect your textboxes, tables and charts to XML data on your computer, or XML data residing on the internet. When you open your PowerPoint presentation, the content of...
Jan 7, 2016 | DataPoint, DataPoint Real-time Screens, How-To
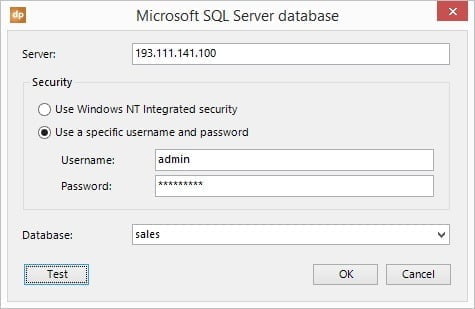
Let’s build a data driven SQL presentation that get its information directly from a Microsoft SQL Server database. With DataPoint you can link your slides to a database and display real-time information on your slideshow or view the latest information on your...
Jan 5, 2016 | Articles, DataPoint, DataPoint Automation
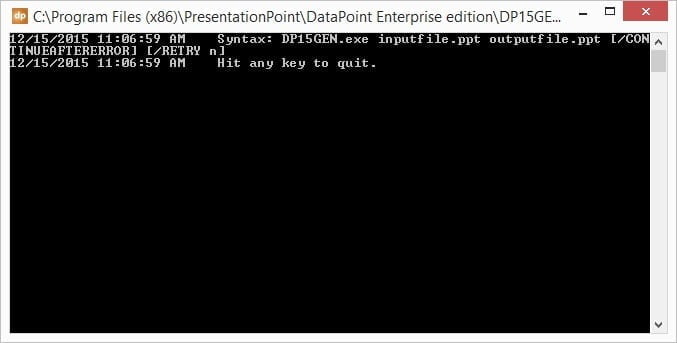
Introduction to PowerPoint Command Line Tool Something else here today about DataPoint. Let’s talk about our DataPoint Command Line Tool for Microsoft PowerPoint to generate presentations via a command job. In other words, generate PowerPoint presentations...

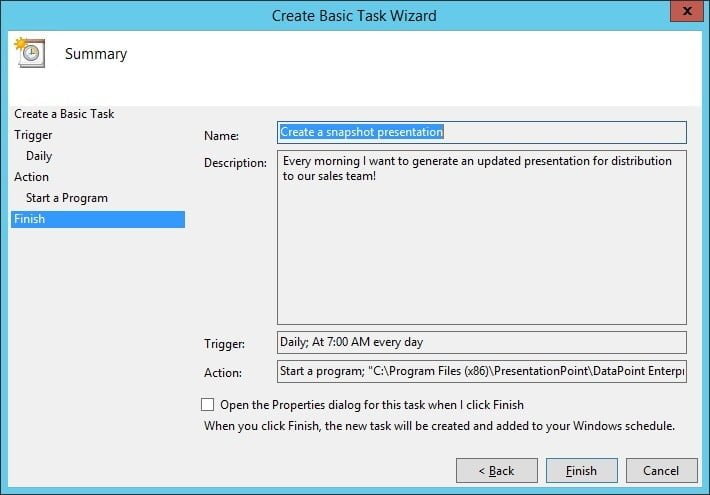
Dec 21, 2015 | DataPoint, DataPoint Automation, How-To
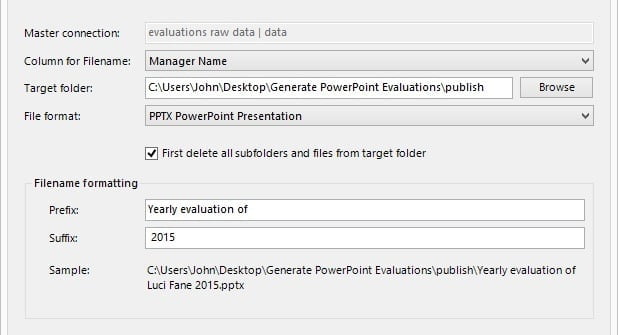
What are Snapshot Presentations? A DataPoint-enabled presentation is a normal PowerPoint presentation that is linked to data sources via the DataPoint add-on. First you set up your data connections and then you start linking these data connections to text boxes,...

Dec 10, 2015 | DataPoint
Introduction DataPoint is our PowerPoint add-on to display real-time information on your slides. There are 4 different editions of DataPoint; Standard edition Enterprise edition Viewer edition Runtime edition Definitions First we need to clarify some words here,...

Nov 24, 2015 | Articles, Attractions and Events, Case Studies, Data Dashboards, DataPoint, DataPoint Real-time Screens, Financial, Reporting, Scoreboards
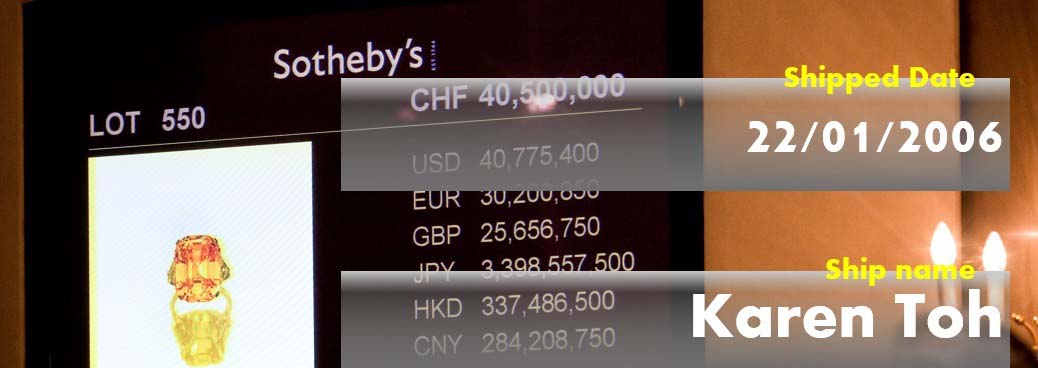
Critical data driven television output Most, if not all, auction houses use data driven presentations, like here on this image, a recent record-breaking auction at Sotheby’s. With a data driven and, more important, real-time presentation, you can display bidding...
Nov 19, 2015 | DataPoint
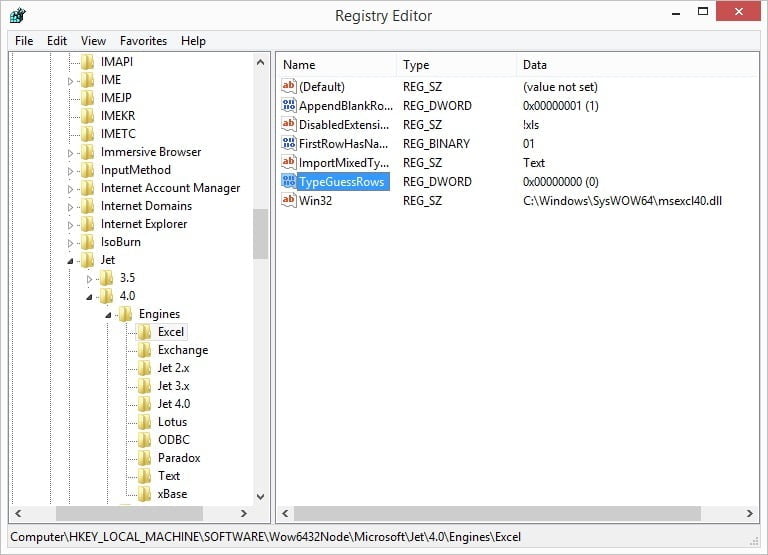
DataPoint users report that sometimes information of an Excel file is not showing at full length or that text data is truncated or cut off. When we have a closer look at this problem, we always see that the first 255 characters of the Excel cell are read into the...
Oct 20, 2015 | DataPoint, DataPoint Automation, How-To
Today we will demonstrate a special feature of our DataPoint Enterprise edition. You need to know that with the DataPoint Standard edition, you can link to excel worksheets and databases already, to display data in real-time and to generate snapshot presentations. Now...
Oct 7, 2015 | DataPoint, DataPoint Automation, DataPoint Real-time Screens, How-To
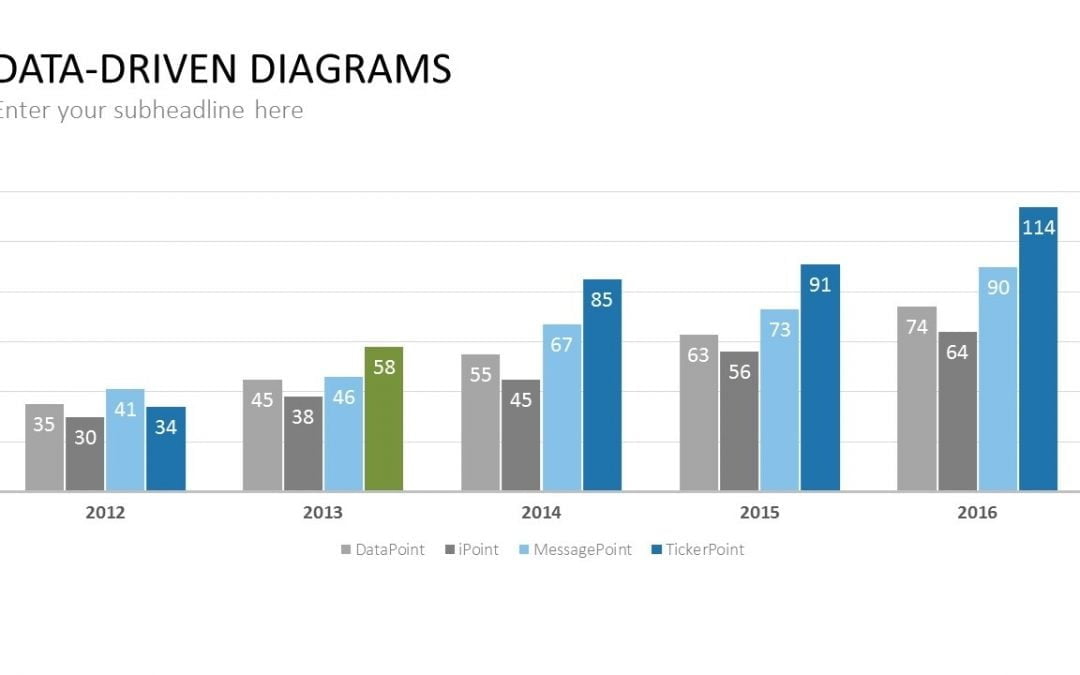
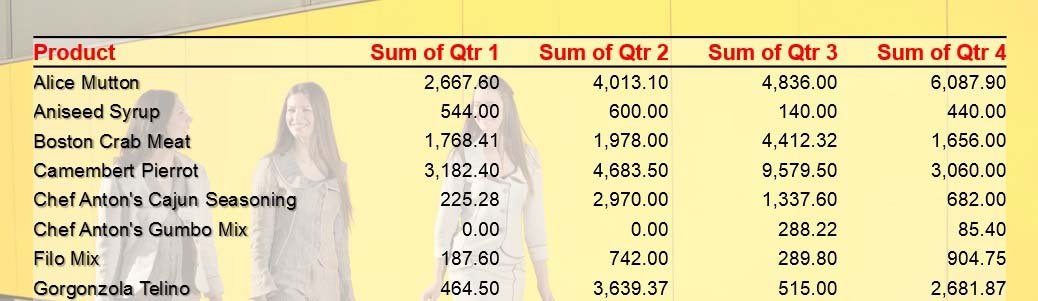
Advantages of using charts There are many reasons to use data driven charts to visualize information in a presentation or on an information screen. First of all, charts are easy to read. Charts are visually appealing, compared to e.g. a text box or table. Easy...
Sep 30, 2015 | DataPoint, DataPoint Real-time Screens, How-To, iPoint
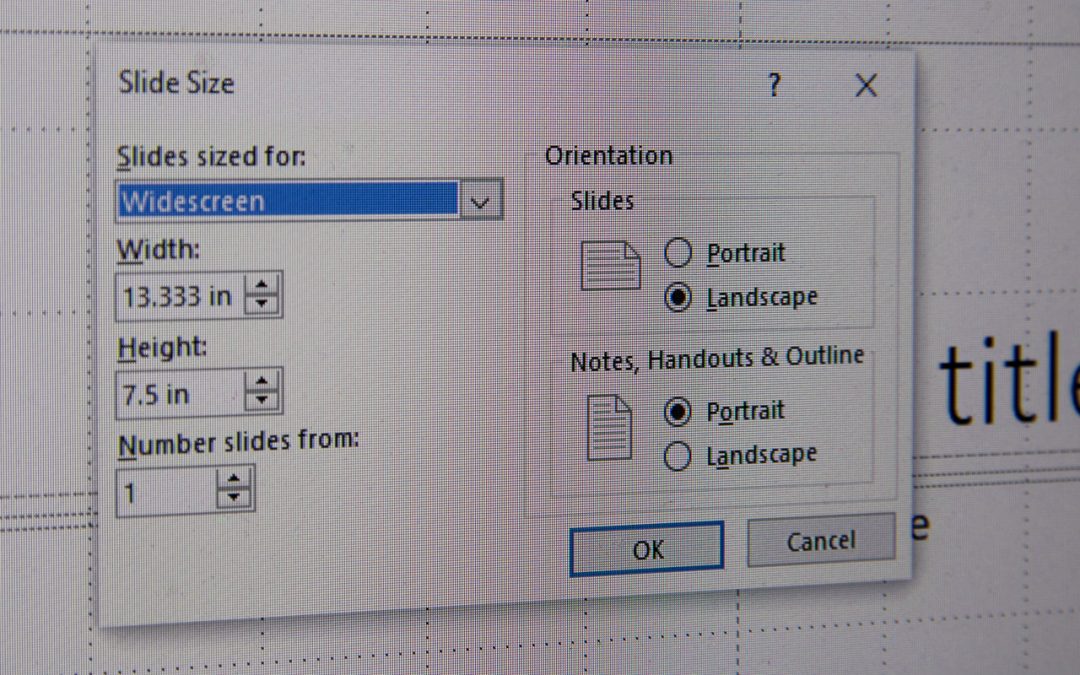
We often get the question on how to set up a PowerPoint presentation in a specific resolution. Here is what we answer. Output device It is best to know your output display device upfront. You better start a presentation in a given resolution or size, before you add...
Aug 12, 2015 | DataPoint, DataPoint Real-time Screens, How-To
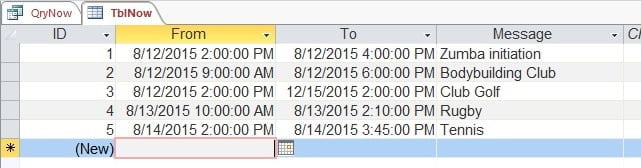
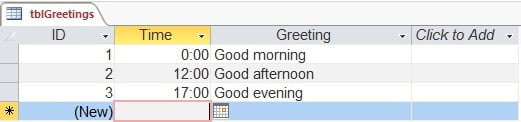
Earlier this week a blog article was published on dynamic greetings in PowerPoint. Now we will go further on that with dynamic and real-time time-restricted information. An information screen is showing much more than just a greeting like “Good Afternoon”....
Aug 11, 2015 | Articles, DataPoint, DataPoint Automation, DataPoint Real-time Screens
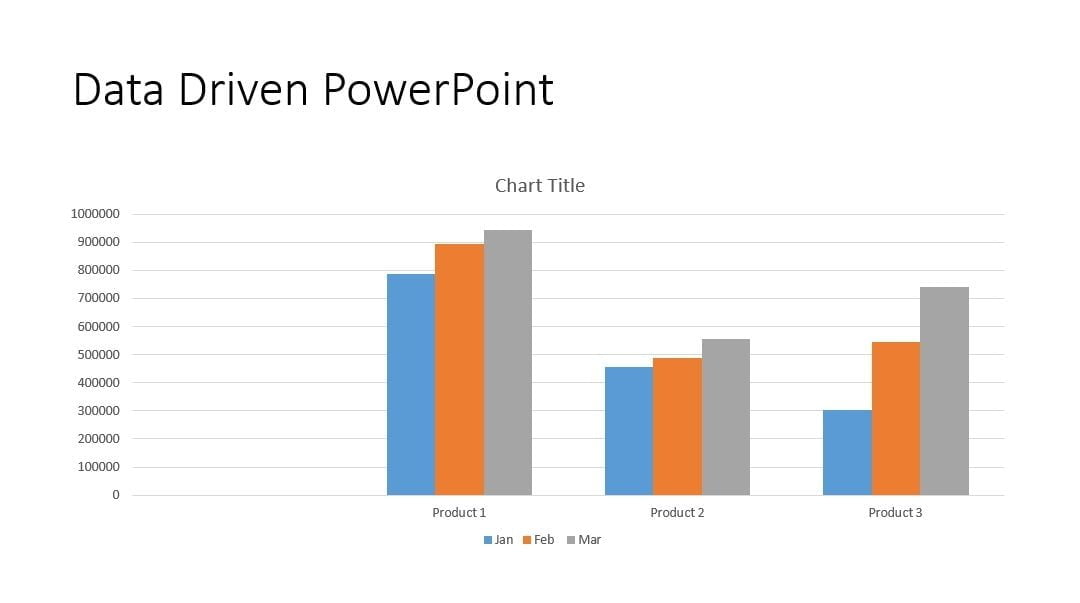
In this article, we will show you how to use Data Driven PowerPoint presentations to create automatically updating PowerPoint presentations. How Are Data Driven PowerPoint Presentations Used? Here are some of the ways our clients use data driven PowerPoint...
Aug 7, 2015 | Attractions and Events, DataPoint, DataPoint Real-time Screens, Financial, Healthcare
Today a very simple article on a mechanism that is frequently used on information screens when you enter a building like e.g. school, hospital or city hall. They welcome visitors with today’s date and time but also with a greeting in text like good morning, good...
Jun 30, 2015 | Articles, DataPoint, DataPoint Real-time Screens
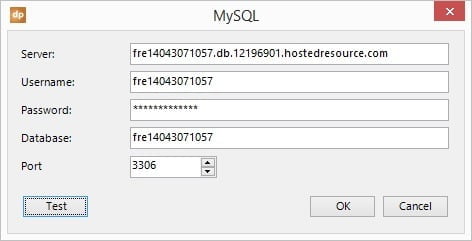
MySQL is a free and frequently used database system and is often used for websites or other internet driven databases and applications. The system will show how the user can use DataPoint to connect a PowerPoint presentation to a MySQL database in order to display...
Jun 25, 2015 | DataPoint
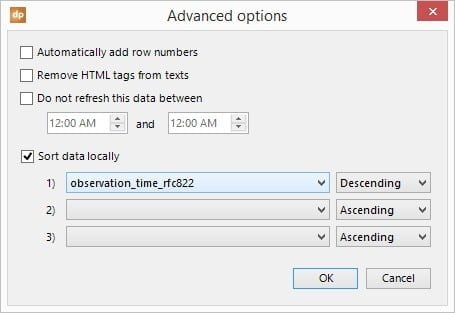
We had a request from a customer who wanted to display weather information from Wunderground. It provides weather information in the form of XML. That is not a problem for DataPoint but he wanted to display information of the observation table and that table has an...
Jun 10, 2015 | DataPoint, DataPoint Automation, How-To, Merge
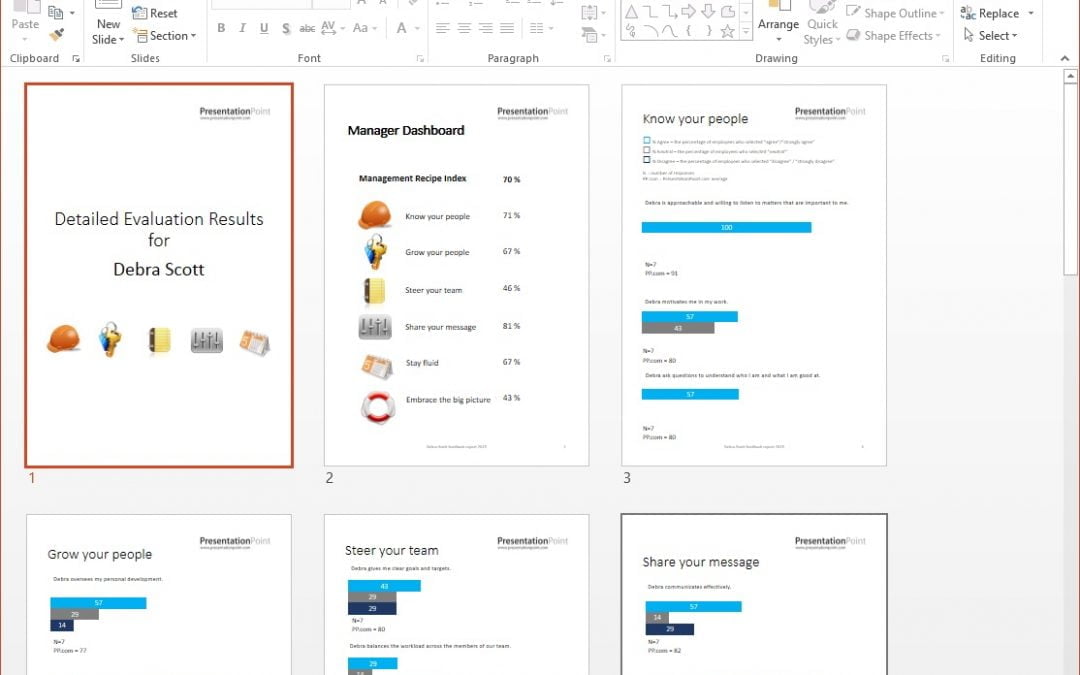
PowerPoint to create personalized documents PowerPoint is a perfect tool to create personalized presentations or documents. The user can create multiple pages and add high-quality shapes and charts to the slides. PowerPoint does this work much better than compared to...
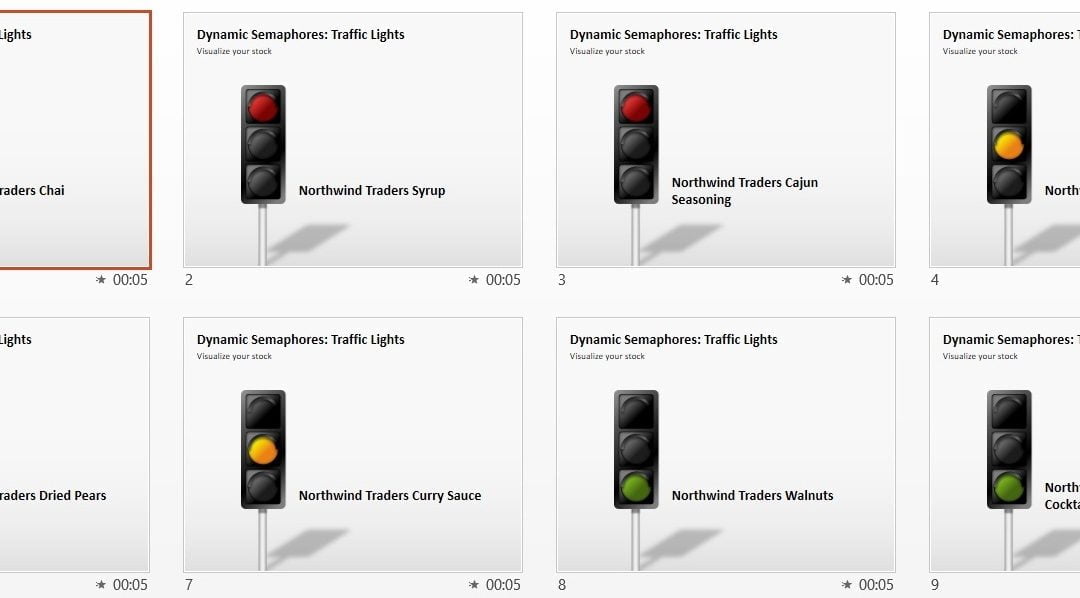
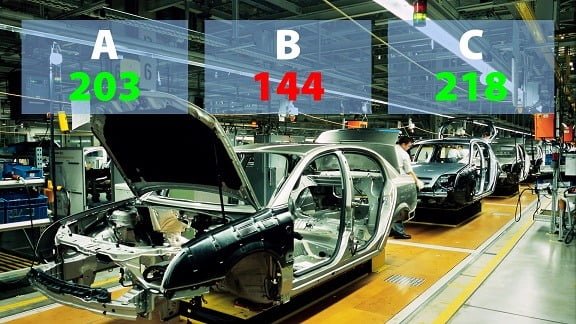
May 21, 2015 | DataPoint, DataPoint Automation
Semaphores are visual signals and are a clear and direct impression of the situation. In Excel and the database the user keeps the raw numbers but when the present data to the audience then the user don’t use that raw data at all. When a number like 82 is...
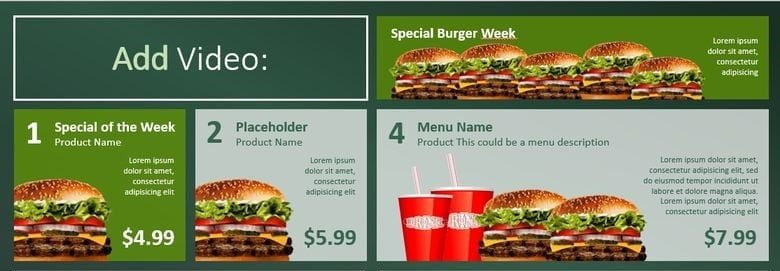
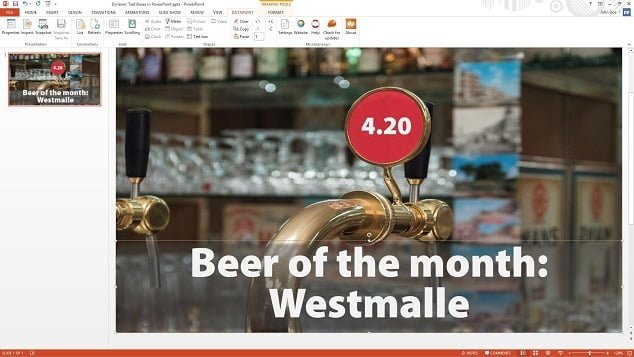
Mar 11, 2015 | Articles, DataPoint, DataPoint Real-time Screens, Food & Beverage, How-To, Retail
What is a Digital Menu Board? Digital menu boards are menus displayed on computer monitors or TV screens. These are commonly used in coffee shops and restaurants. They include pictures and prices of menu items. It is easy to update and can be connected to...
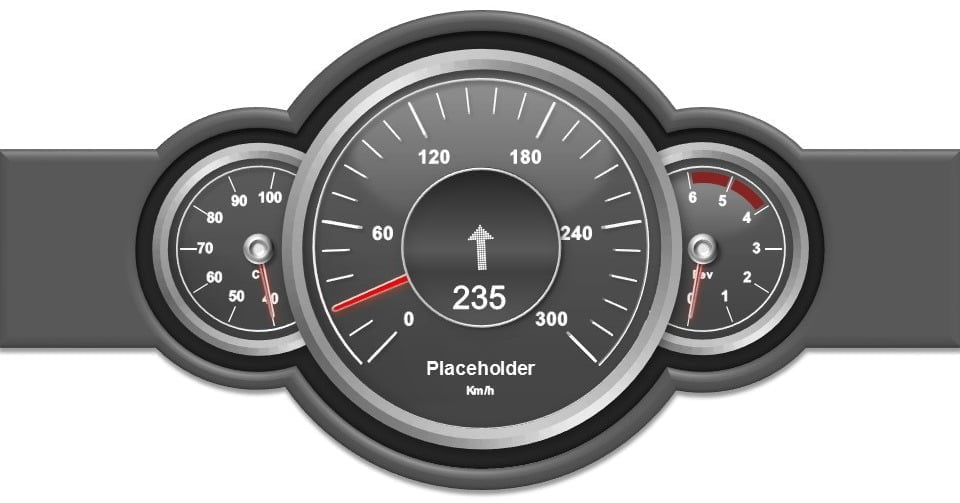
Mar 9, 2015 | Data Dashboards, DataPoint, DataPoint Real-time Screens, How-To
Dashboards are great to visualize information. Think about the dashboard in a car. The speedometer there immediately gives a graphical indication of the speed. In a glance the user will see if driving too fast. Link for dynamic data The user can create similar digital...
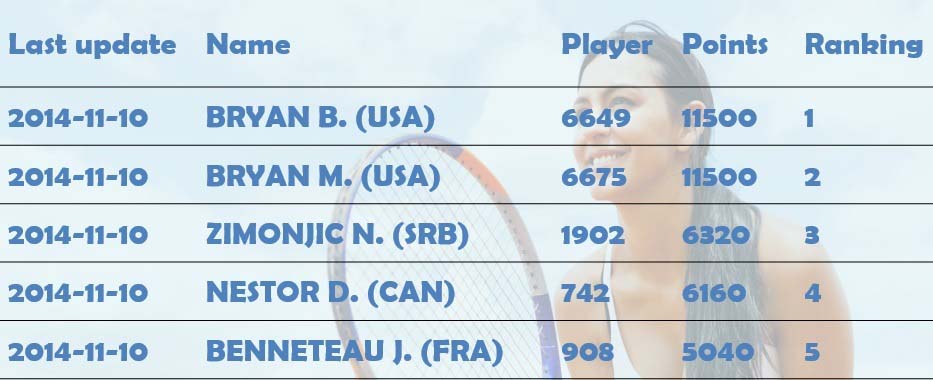
Feb 12, 2015 | Attractions and Events, DataPoint, DataPoint Real-time Screens
In this article we will use the data service of xScores once again. This time not for soccer but for tennis ATP ranking. Now we will display the ranking in a table and this information is collected by the DataPoint PowerPoint add-in for data driven Microsoft...

Jan 22, 2015 | DataPoint, DataPoint Real-time Screens
Pictures say so much more than words. That is why advertising cannot live without pictures, photographs, and video. An ad with only text is boring and unexceptional. People love to see graphics to visualize messages. With DataPoint the user can create dynamic...
Dec 1, 2014 | Articles, Case Studies, DataPoint, DataPoint Automation
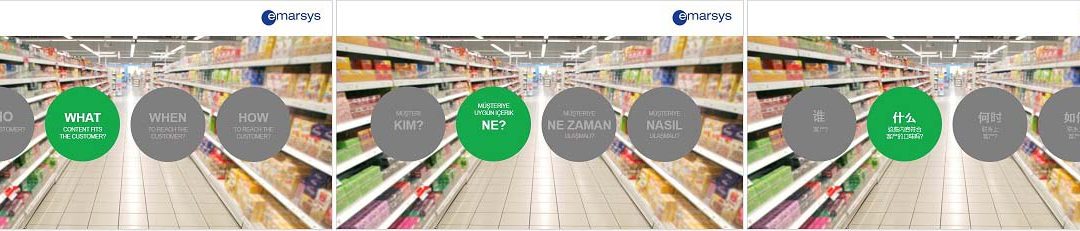
Another recent customer to join is Emarsys, a global provider of cloud-based marketing solutions. With a customer base covering more than 120 countries and an ever-evolving platform of products and services, keeping the global sales presentations up to date in...

Nov 24, 2014 | DataPoint, DataPoint Automation, DataPoint Real-time Screens, How-To
In the last article I explained how the user can connect a Microsoft PowerPoint presentation to a Microsoft Access database. The example presentation that I created was linked to the demo northwind Access database. In that article I linked and displayed order...
Nov 20, 2014 | DataPoint, DataPoint Real-time Screens, How-To
With DataPoint, the user can add new functionality to Microsoft PowerPoint for data driven presentations and update their content when the user open the presentation and while running the slide show. With PowerPoint and DataPoint combined, the user can have some kind...
Nov 17, 2014 | DataPoint, DataPoint Automation, DataPoint Real-time Screens, How-To
Sometimes you want to display live information in a PowerPoint presentation. Maybe you need to display scores or results in real time to people on a television screen. A manager needs to see production figures of a factory at his desk. People on the floor need to know...

Nov 13, 2014 | Attractions and Events, DataPoint, DataPoint Real-time Screens, How-To, Scoreboards
Something completely different in this article. Humans like soccer and they follow their favorite club(s) and the rankings. Now you can display live soccer information like ranking and scores in real time in a data driven PowerPoint presentation. Some people run a...

Nov 11, 2014 | DataPoint, DataPoint Real-time Screens, How-To
We have 3 possible scenarios for displaying weather. This is a dedicated weather add-on for PowerPoint to display weather information in a presentation. This is very easy to use and it can show current weather information and forecasts. If you need to display the...

Nov 7, 2014 | DataPoint, DataPoint Real-time Screens, How-To
Time is money and we have to drive for work, for deliveries, for meetings etc. The travel time is calculated and it gives you a constant update on the arrival time. Unfortunately there are traffic jams and accidents as well. The government or the owner of a toll-way...

Nov 4, 2014 | Articles, DataPoint, DataPoint Real-time Screens, How-To
We have 3 possible scenarios for displaying news. This is a dedicated news add-on for PowerPoint to display news or RSS information in a presentation. This is very easy to use and can show headlines, texts and images. If you need to display news or RSS information,...

Oct 23, 2014 | DataPoint, DataPoint Real-time Screens, How-To
The year is almost ending and maybe you want to display a countdown till January 1st. Or you need a countdown for the opening of your new shop? This article will show you how you can run a data driven countdown in PowerPoint. For a countdown you have to set a target...

Oct 14, 2014 | DataPoint, DataPoint Real-time Screens, How-To
First of all, why would you like to display database information in a presentation? Look around you! You are surrounded by data enabled presentations. Take a train station as an example. The LED screens and VGA computer screens that you see in a train station, are...
Oct 9, 2014 | DataPoint, Financial, How-To
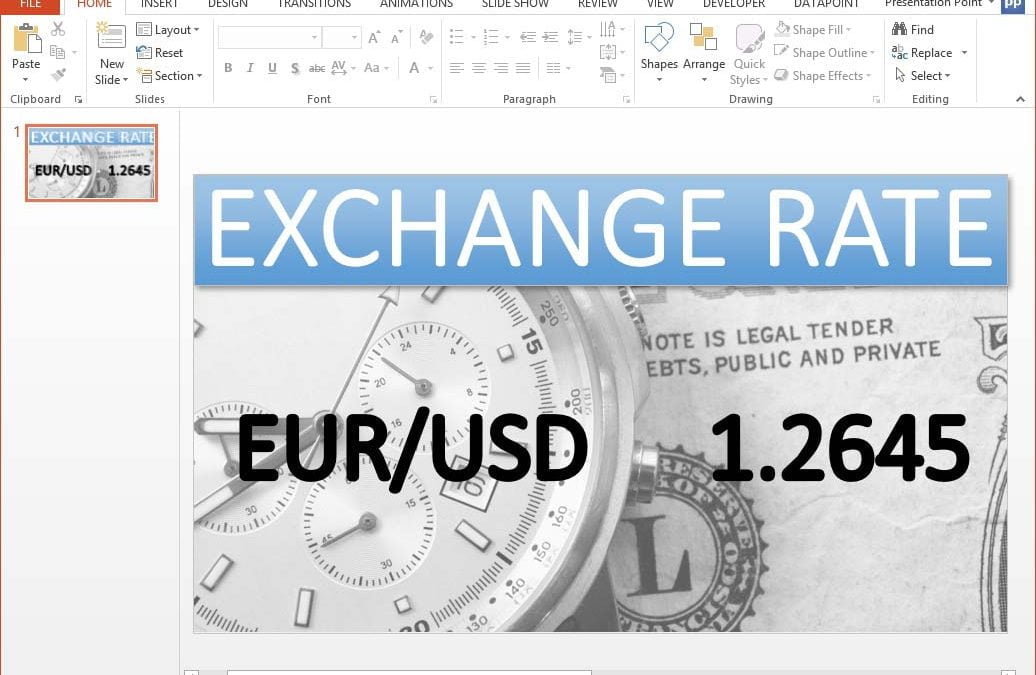
Different currencies are used worldwide for business and travel. When you do business with another country you might have to deal with a different currency that you are used to use in your own country. To estimate a value you need to know the current exchange rate...
