
Share Key Performance Indicator dashboards on production floors, meeting rooms and more
KPI Dashboard Displays
Key Performance Indicator (KPI) Dashboards provide at-a-glance critical business information. Create automatically updating KPI dashboards that display the latest information, keeping your management teams and employees informed.

TEMPLATES

Increase Employee Engagement
Track progress towards output goals.

Display Dashboards in Critical Areas

Include Relevant Local Information
Software Solutions
DataPoint
DataPoint is a PowerPoint add-on that lets you easily create real-time KPI dashboards by connecting your presentation to nearly ANY data source. Combine information from accounting systems, sales reports, customer satisfaction tracking and other sources into a single-slide or multiple-slide dashboard and show the real-time information anywhere.
DataPoint Industrial Edition provides all the functionality of DataPoint and adds the capability of connecting to data from Object Linking and Embedding for Process Control (OPC); a software standard that helps Windows programs to communicate with industrial hardware devices.

iPoint
iPoint lets you manage your digital signage either on-site or remotely via the Internet, allowing you to create playlists of graphics, videos, audio, music, PowerPoints and more.
You can also control what shows on each screen, providing safety information in staff common areas, sales and marketing info in your sales team area, and manufacturing monitoring information on your factory floor.
Case Studies
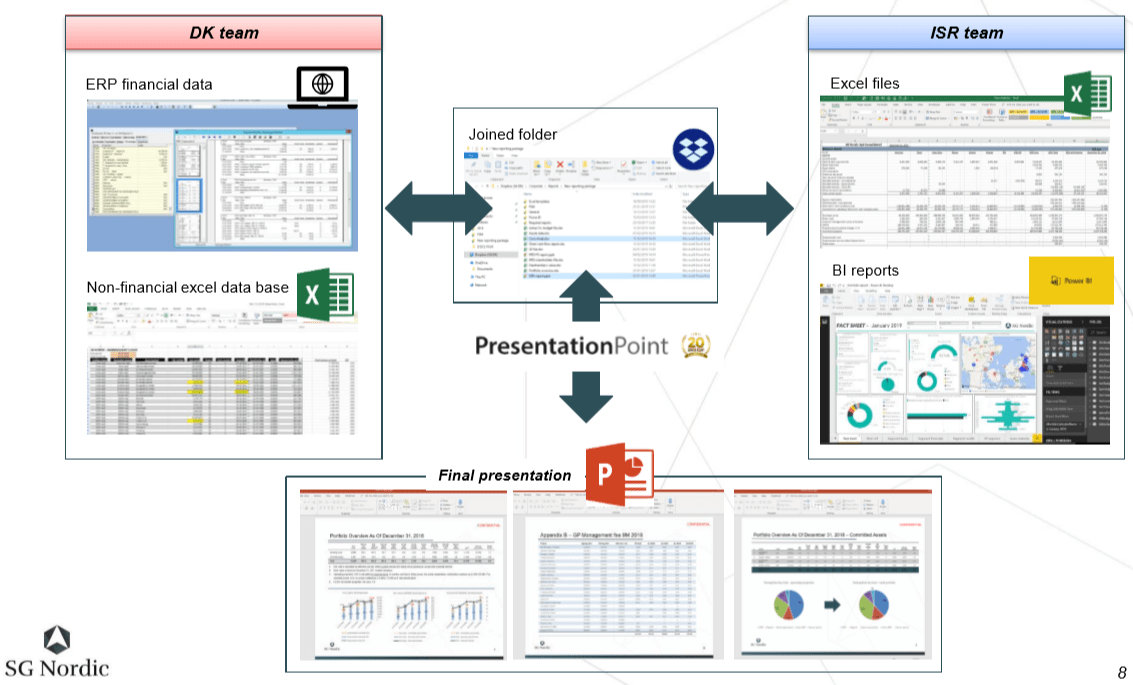
SG Nordic
SG Nordic, a private real estate investment company, uses DataPoint for reporting to create synchronization between all files and data sources so when one source is updated – the other sources will be automatically updated.

HD Supply Holdings Inc.
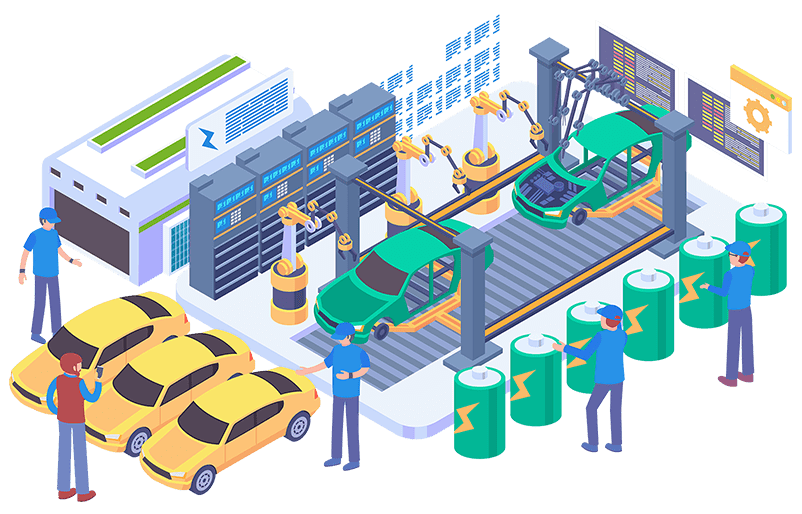
HD Supply team members used our software to create a manufacturing Key Performance Indicator dashboard to monitor their KPIs in real-time.
They found that their productivity went up 25% when they could get real-time data on what was happening on the manufacturing floor because they could identify and deal with problems faster.
Lundins
Lundins is a manufacturing unit with the Trioplast Group in Sweden.
They use DataPoint to monitor their manufacturing process, tracking certain key performance indicators (KPIs) such as:
LTAR-Lost Time Accident (index rating)
Volume per Man Hour
Energy consumption
Delivery on Time
OEE Manufacturing
Stop Losses
Scrap Quantity
MasterBrand Cabinets
MasterBrand uses iPoint to display general company information as well as weather, local/national news, and more specific plant information concerning work schedules and defects.
They use DataPoint to provide current information for weather, news as well as to set up KPI reporting screens with total cabinet defects, specific defects and other department-specific information which is either pulled from the Internet or from SQL databases.

