Stock market prices are hot and changing every second you look. In some financial markets and offices, you want to continually monitor real-time stock quotes on television screens. This can perfectly be done in PowerPoint with our great DataPoint plug in.
Use finnhub.io
In this article, we are going to connect your presentation (and thus the slideshow later on when we run the presentation) to a data source, a stock market quote API. For this article, we will connect to finnhub.io. They have a great API and a free plan that we can use to illustrate the use of real-time stock quotes on our screens.
Connect to the website and create an account.
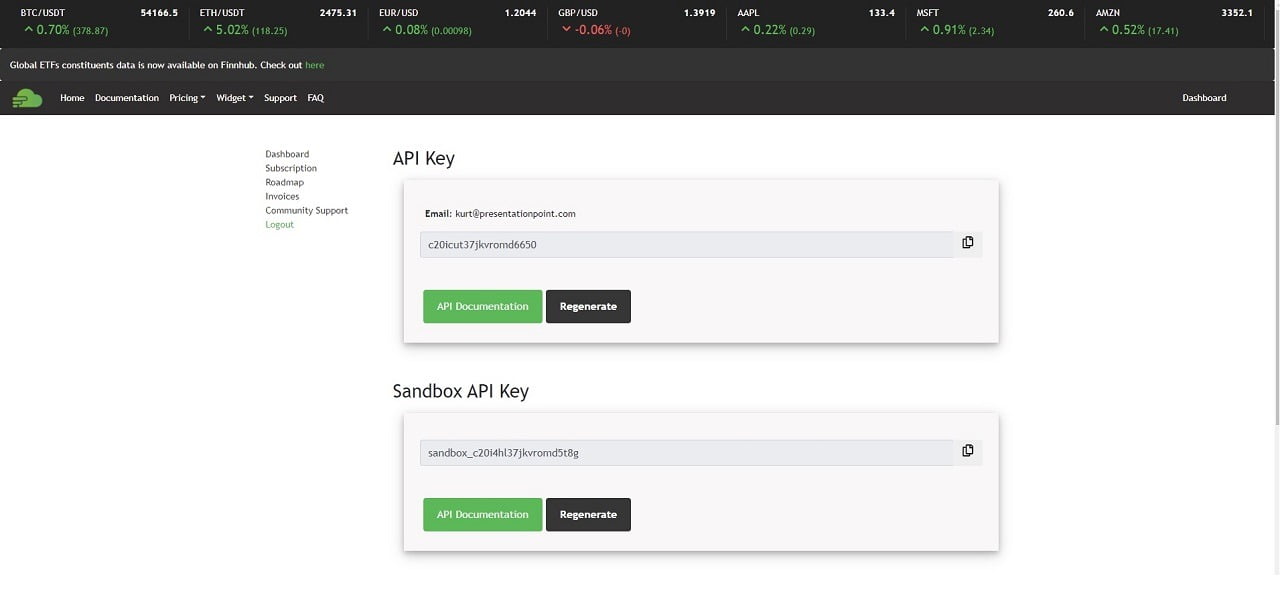
After the creation of an account, you will get an API Key that we can use for the communication with their servers. The API key is typically used to identify you and that is also what they use to check and count your usage.
Typical for this API communication, we will need to use this API key in every request that we send to the server.
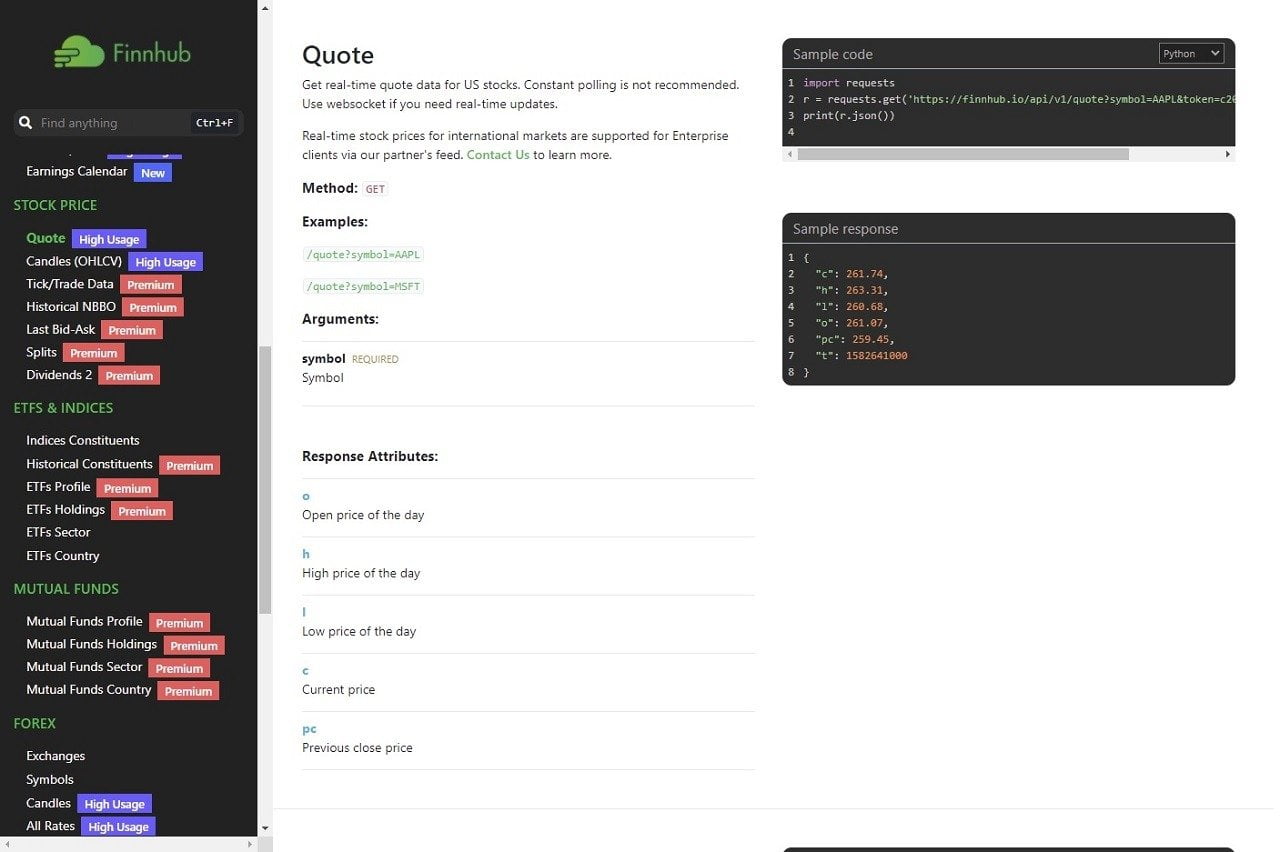
Look at the documentation of this website, at scroll down at the left to the Stock Price section. Click the Quote section. At the right, you will see a typical URL that you can use like this one:
https://finnhub.io/api/v1/quote?symbol=AAPL&token=c20icut37jkvromd6650
You can change the symbol to the company that you are tracking. And change the token value to your API key.
When you execute the URL in a browser, then some data in JSON format is returned. Web servers or API servers typically return data in XML and/or JSON format.
{"c":133.5,"h":133.75,"l":131.31,"o":132.36,"pc":133.11,"t":1619035202}
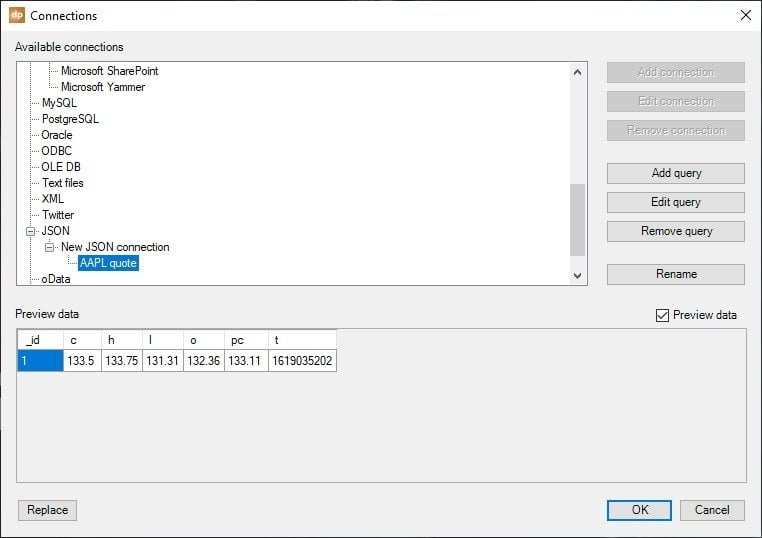
Check the website’s documentation. The column with name c and value 133.5 stands for the current value of the quote. H stands for the highest value. L for the lowest value, and so on.
Use Stock Quotes in PowerPoint
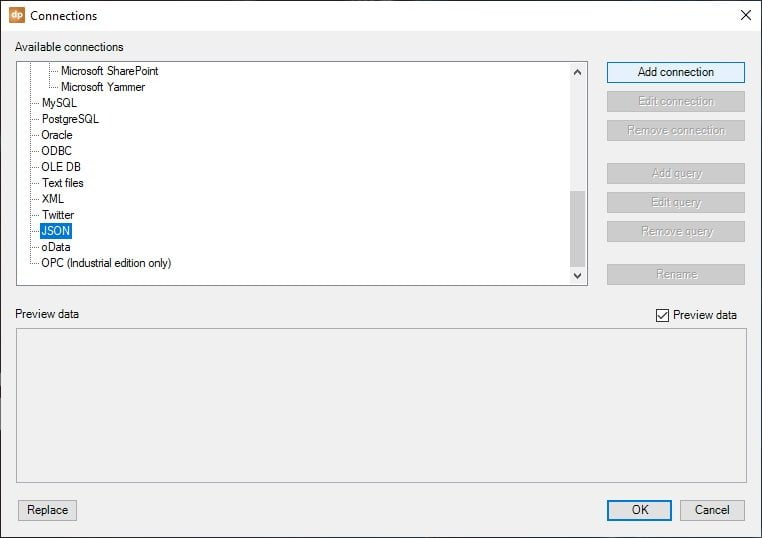
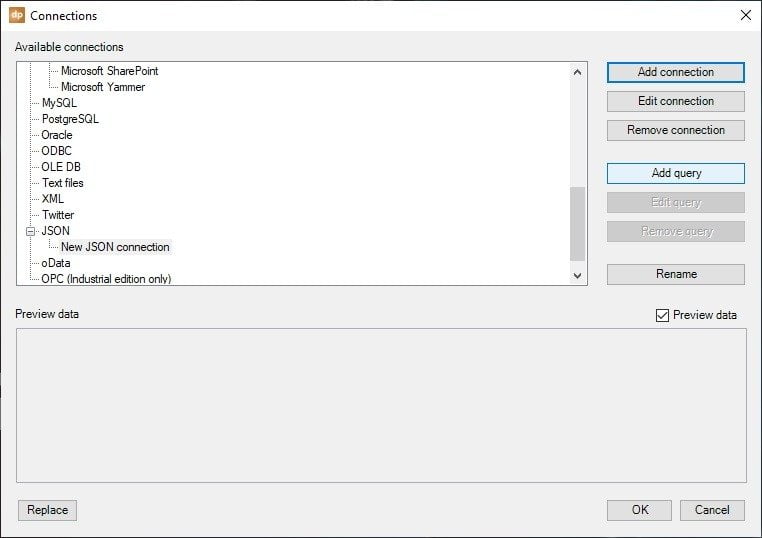
Launch PowerPoint and start with a new presentation. Click to open DataPoint and click the List button of the Connection group there. Select JSON as the data provider from the list, and click the Add connection button.
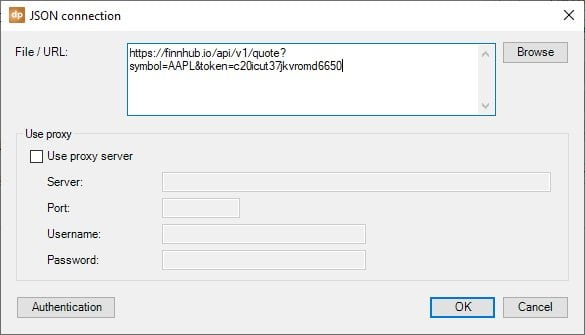
Paste here the URL that we collected from the Finnhub account, and hit OK.
Then click the Add query to continue on this data connection.
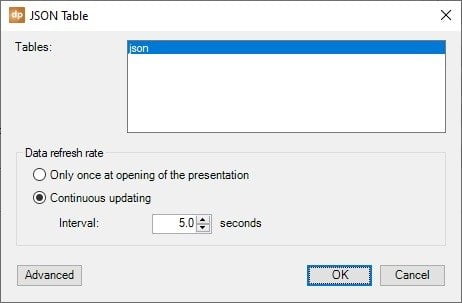
Easy! There is only one table there. Select it and choose the refresh rate that you want to use for real-time updates. Hit OK when done.
Voila, your first real-time stock quotes are set up, and your presentation is connected to that. If you want, you can give it a proper name.
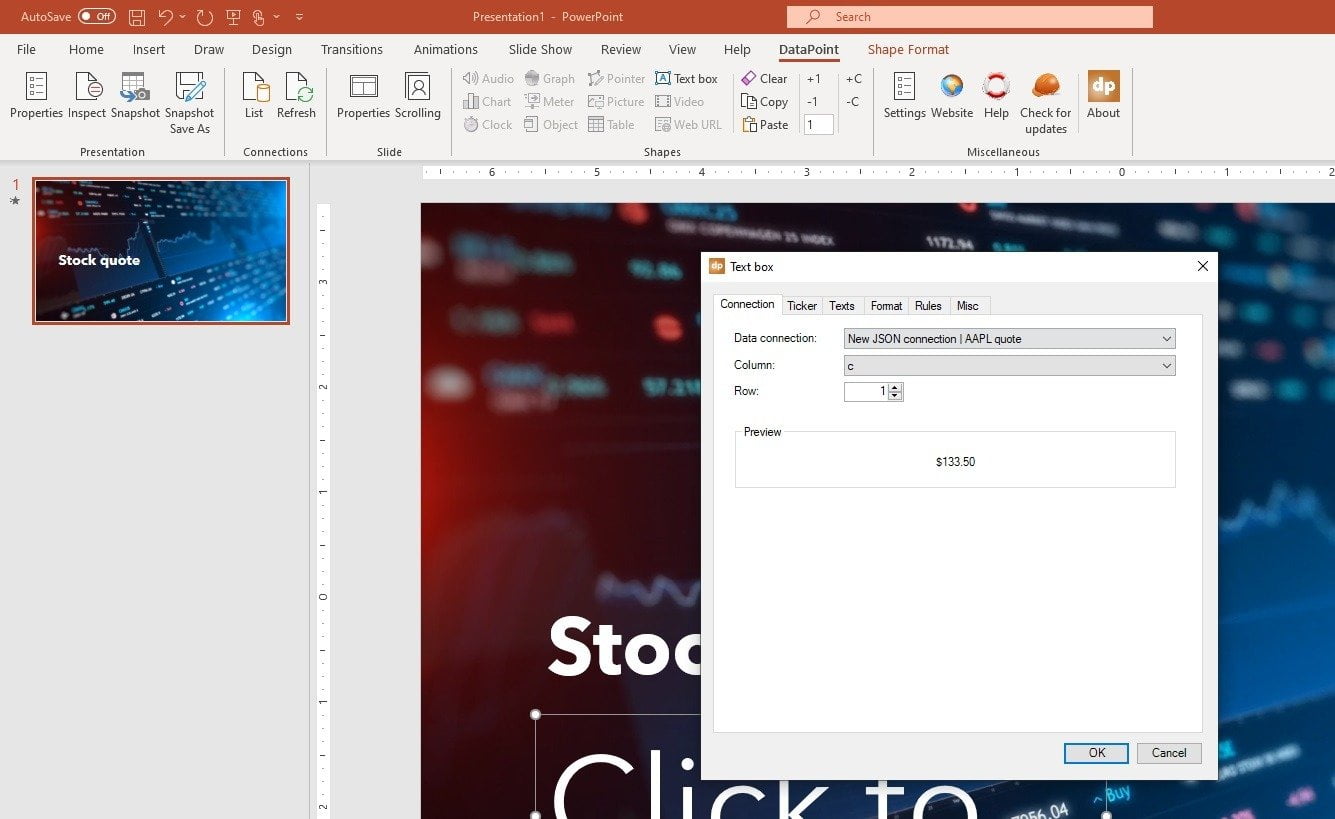
Insert a new, or select an existing textbox of your slide. Then click DataPoint, then the Textbox button.
At this form, you set the data connection to our freshly created connection, and select the column to the c column. Remember, that column was holding our current value. Optionally you can click the Format tab and choose the format that you want to use.
How to Run the Slide Show with Real-Time Updates?
Run the slide show on your computer, or use a dedicated television screen in your office. The stock quote that is displayed there, is updated in real-time.
You can now add more queries to monitor other stock quotes and companies. You add them to this slide here, or use multiple slides in your presentation.
When you have read and followed this article, then you have completed a real-time stock quotes monitor screen in some 10 minutes then. Thanks to our DataPoint plugin, your vital information is kept up-to-date on your screens or reports.

