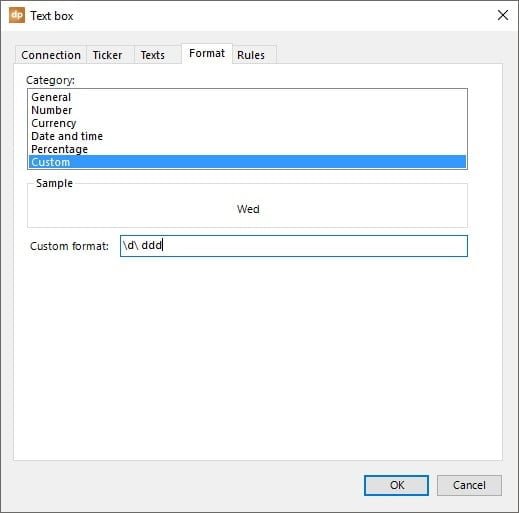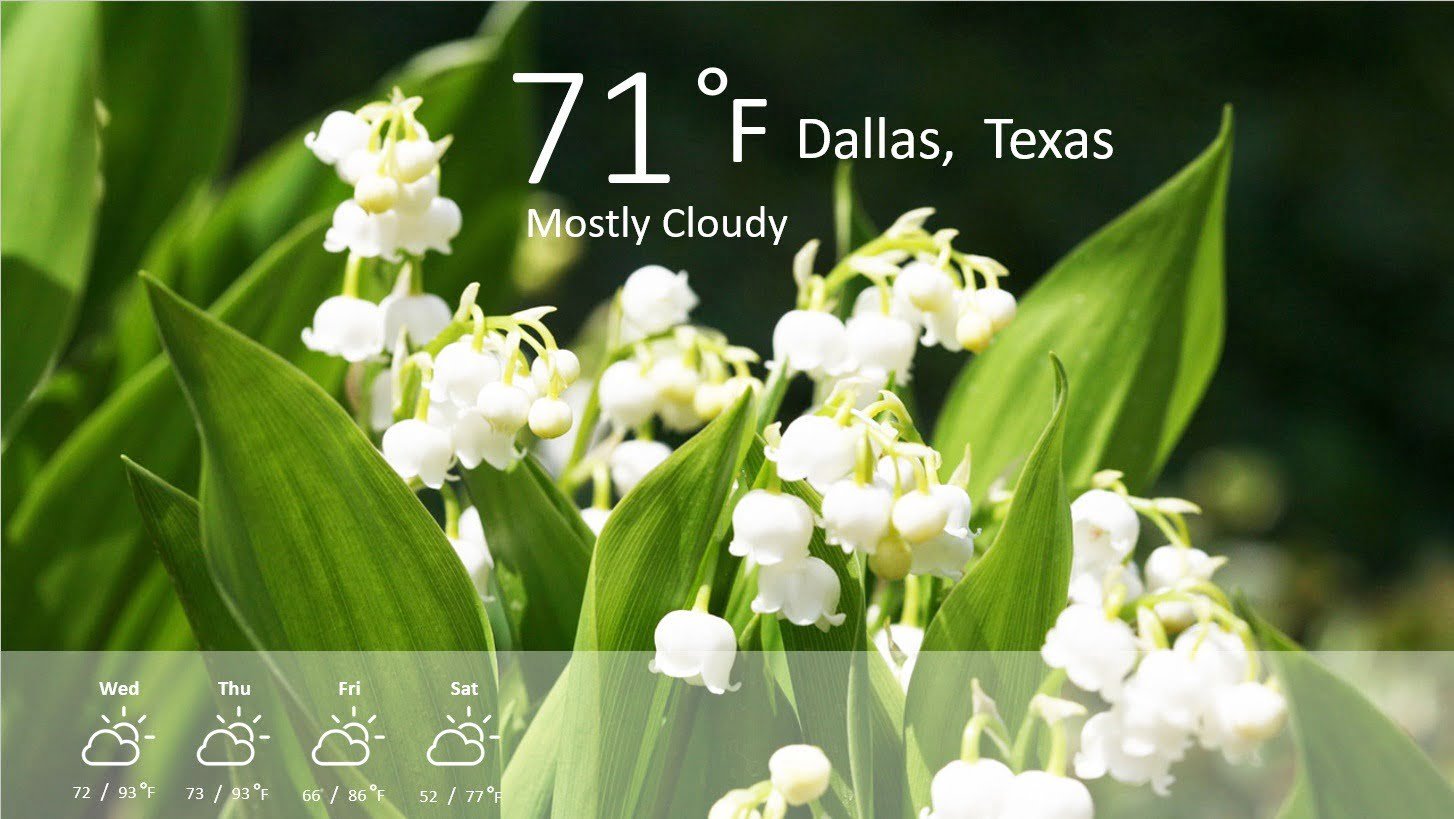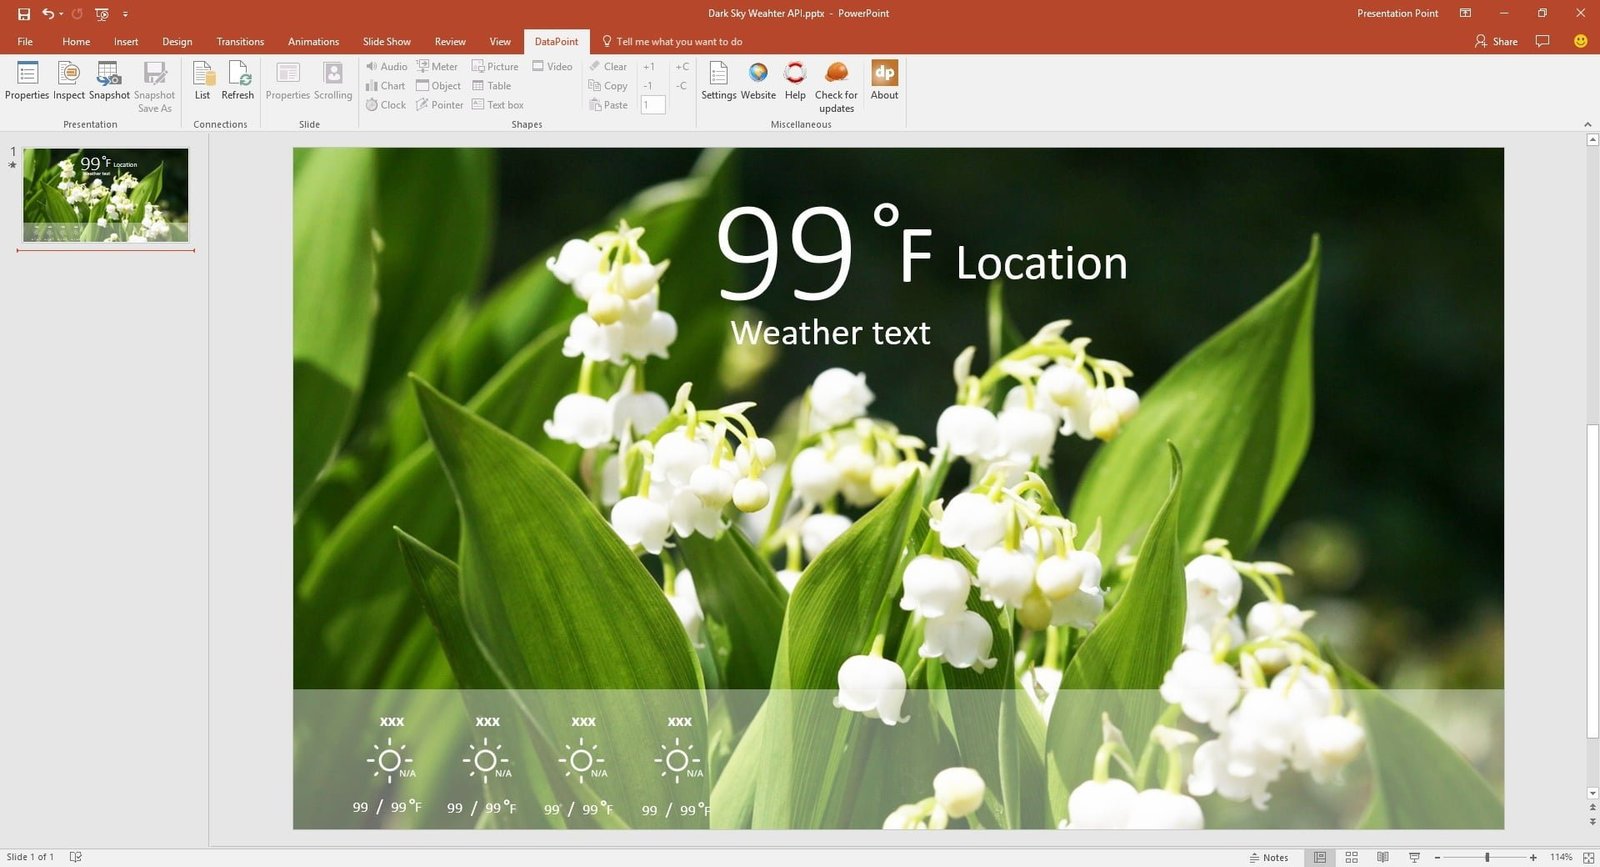
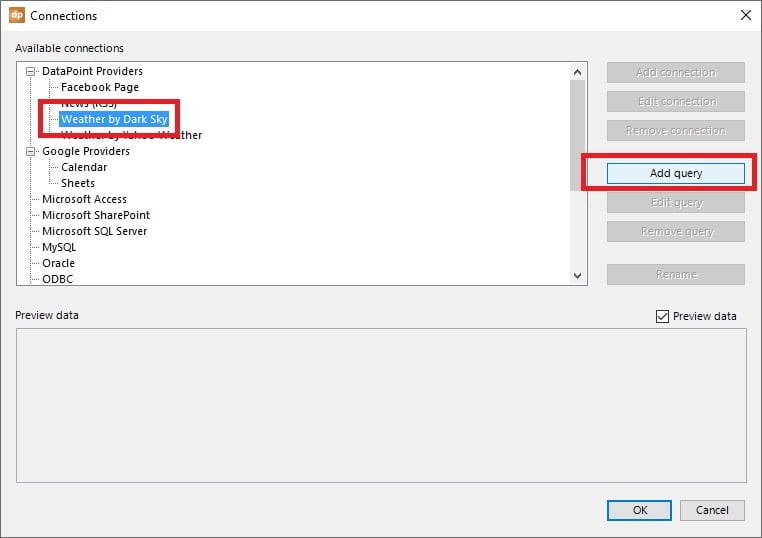
Click DataPoint in the PowerPoint ribbon to open its options. Then click the List button of the Connections group.

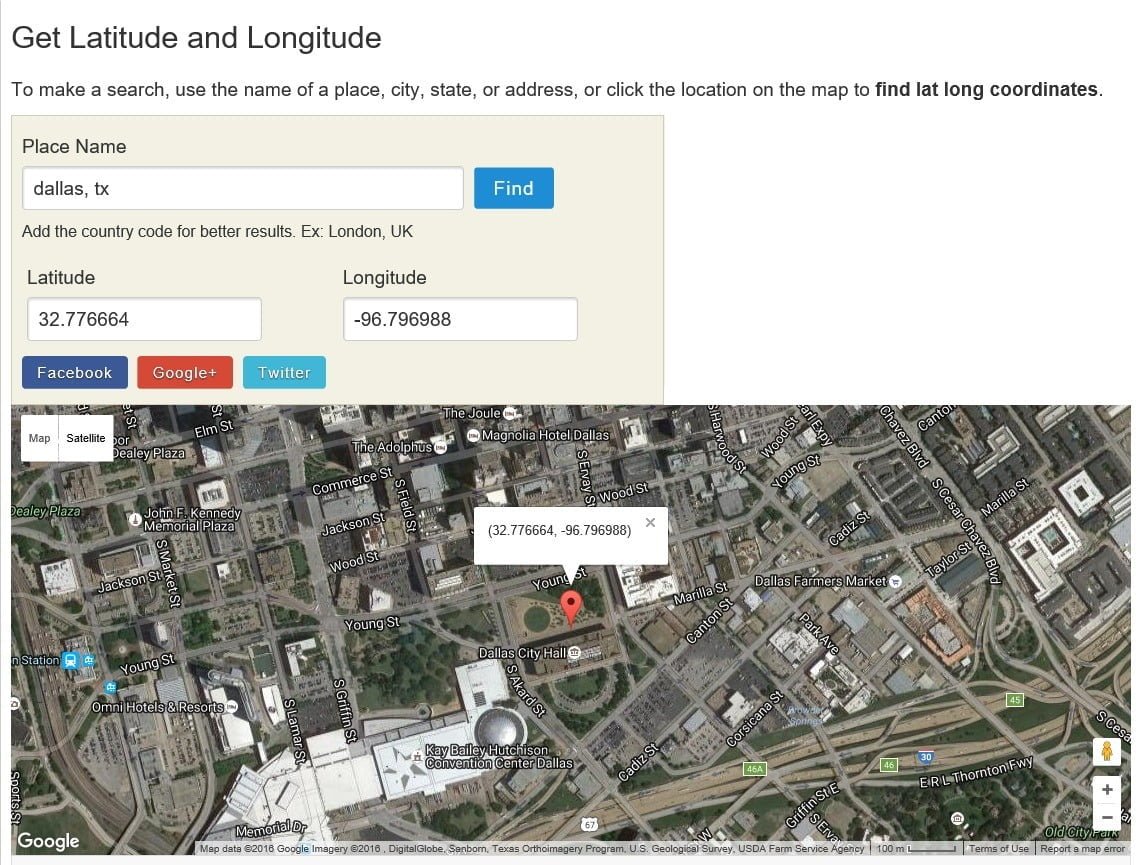
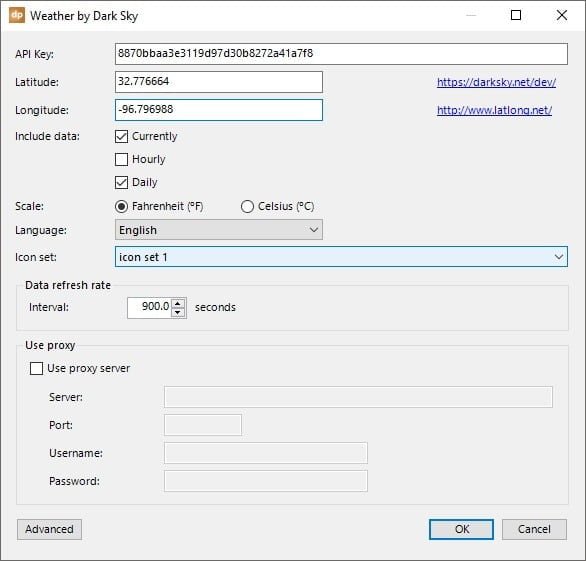
Next we need to know the location or position to get the weather information from. This point on our globe Earth is set as latitude and longitude position. If you don’t know the latitude and longitude of your city, just click the www.latlong.net link and look up the information.
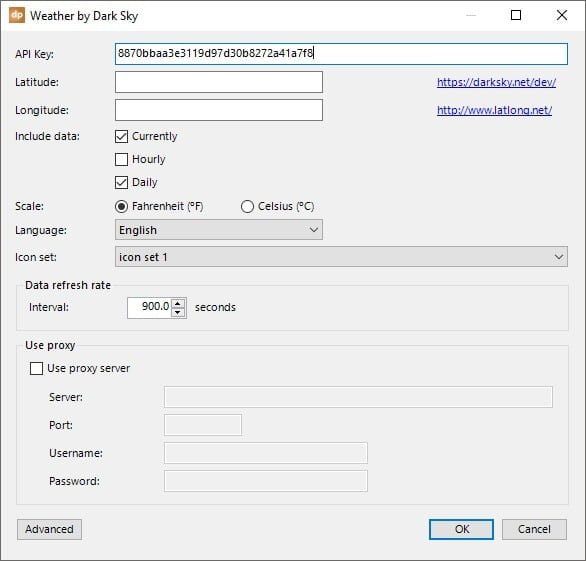
Furthermore, you can check if you want to include currently, hourly and daily information. Default information will be currently and daily, which is the typical information that you put on your slide.
Choose your scale; Fahrenheit or Celsius.
Select the language in which you want to display the weather condition texts.
Choose an icon set for the weather icons.
And finally check and change your data refresh rate. 900 seconds is 15 minutes. So with this rate, you would perform 94 calls (24 x 4) per day.
Click OK to close.
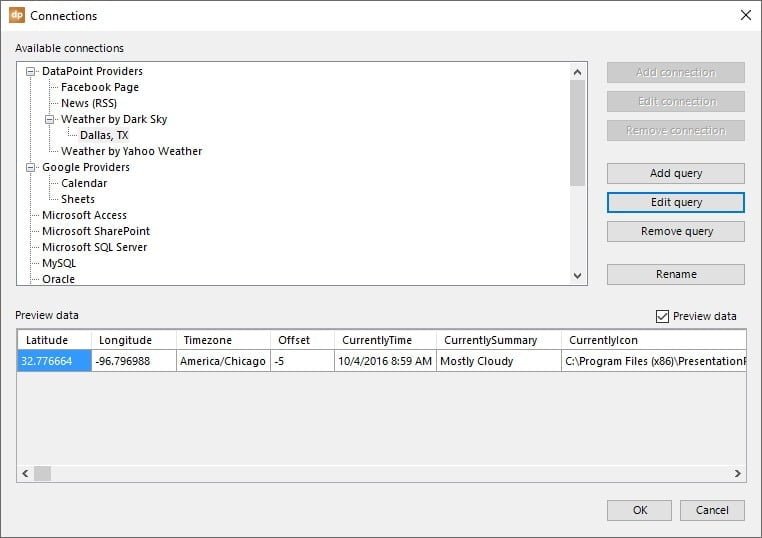

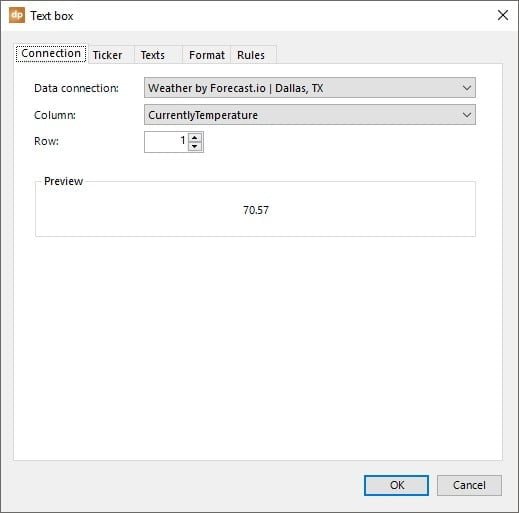
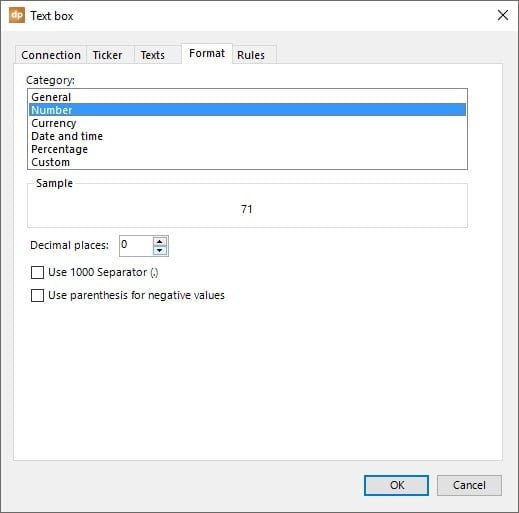
Note that there are decimals in the number and we don’t want to display this here as irrelevant.
