PowerPoint presentation to show Key Performance Indicators
Key Performance Indicators (KPIs) are a great way to measure the performance of your business. They show how you’re doing against your goals and help you keep track of changes over time. KPI templates for a PowerPoint presentation can be used for many different...
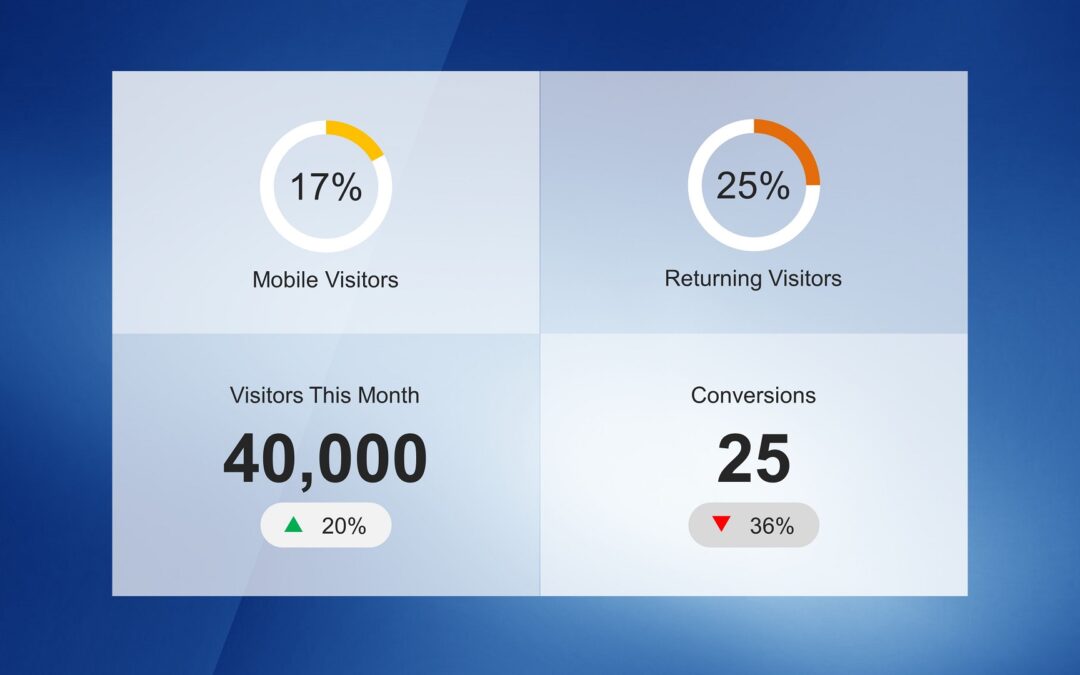
What Is a Data Dashboard?
The Power of Data Dashboards Wherever your eyesight wanders around, you will see data, and with every step, you will experience the changes it has brought about. For example, if you look in the world of business, data is being used constantly to analyze, innovate,...
Crypto Dashboard using PowerPoint
In this video, we explore how to create a crypto dashboard in PowerPoint to show real-time pricing of cryptocurrencies. See the video above to see the crypto dashboard in PowerPoint in action. The first step whenever you are creating a data-driven PowerPoint...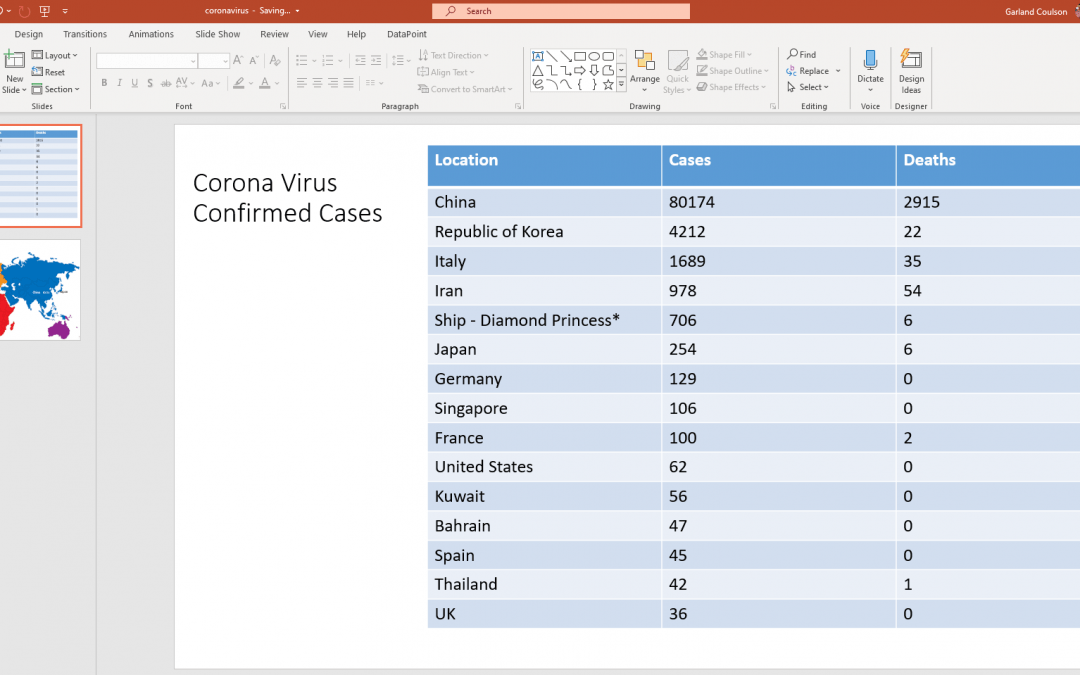
Show Coronavirus Data in PowerPoint
In this video and article, we are going to show you how to add real-time Coronavirus data or any other real-time data to PowerPoint using our software tool, DataPoint. Finding Coronavirus Data The first step to displaying any real-time data is to find out where to get...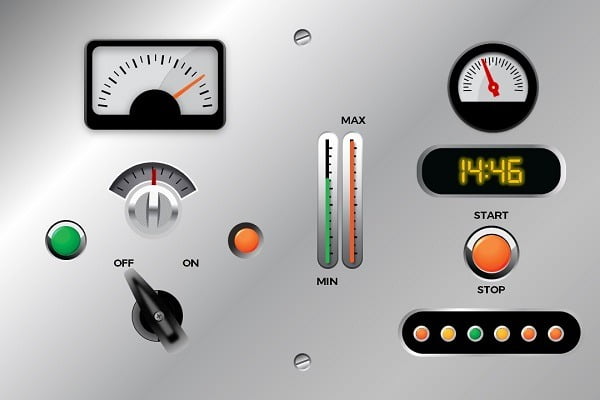
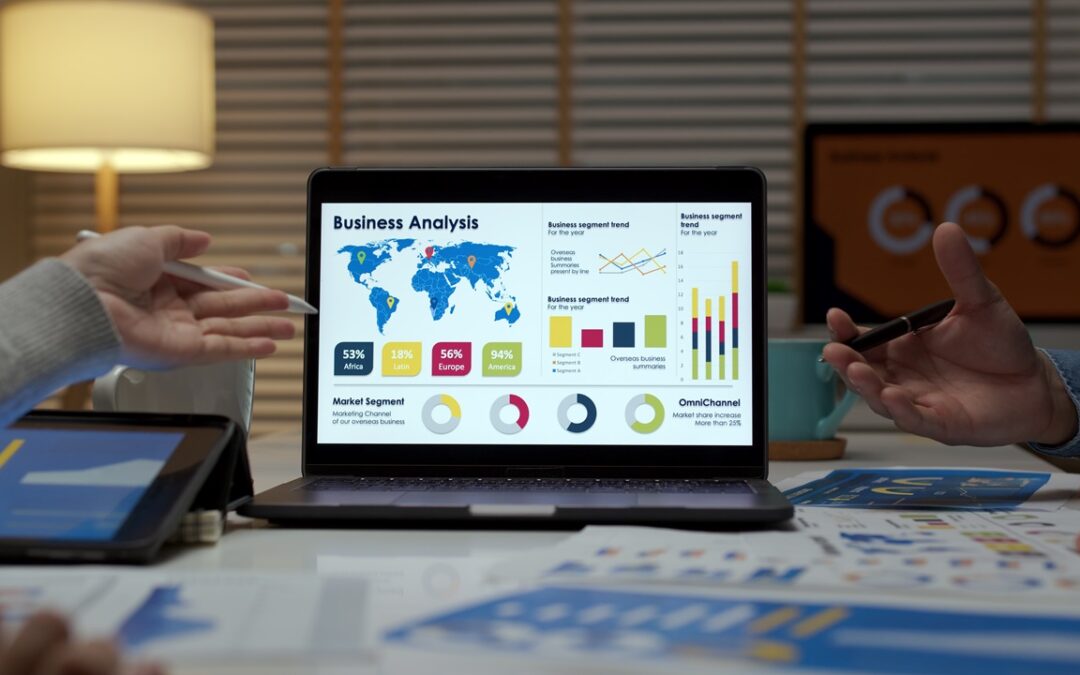
How to Create Complex Data-Driven PowerPoint Dashboards
We recently created this data-driven dashboard in PowerPoint by connecting our presentation to a database with our DataPoint plugin. The result is quite astonishing. The database is basically a dummy, where we have a small utility to execute random updates on the...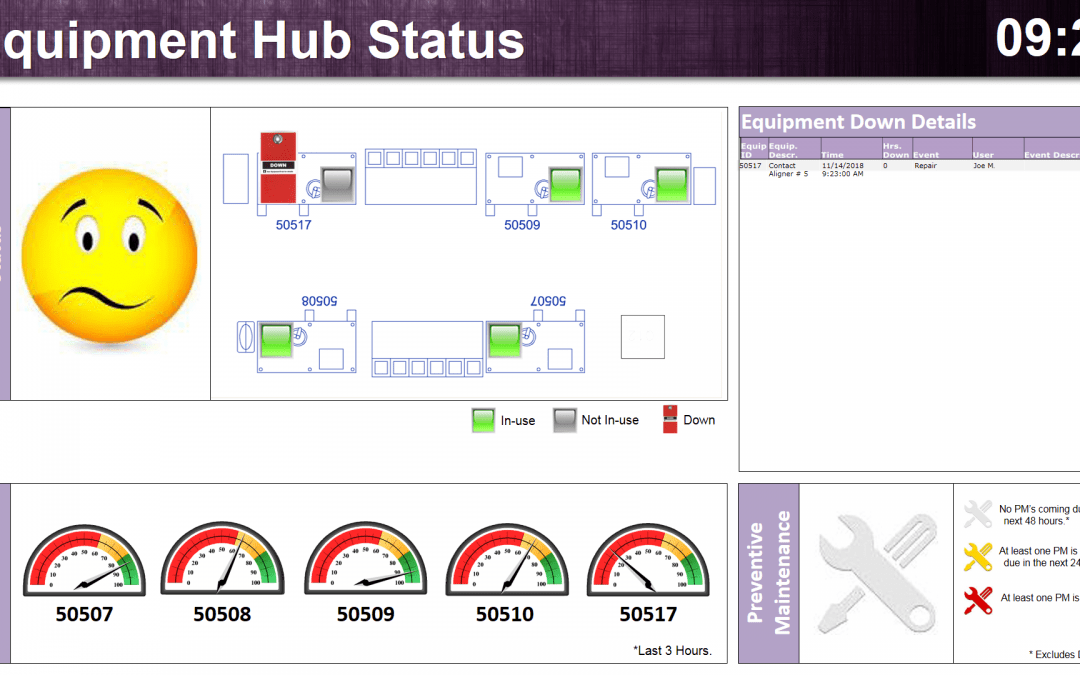
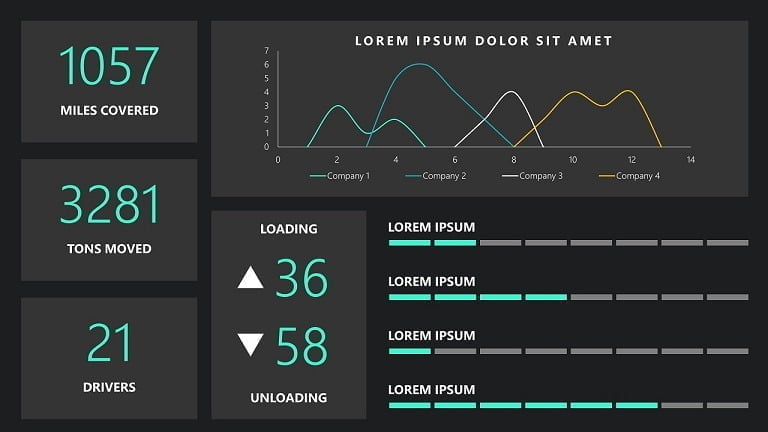
How to Create an Equipment Monitoring System Dashboard
Recently one of our customers who wishes to remain anonymous sent us a screenshot of how they set up an equipment monitoring system dashboard system using our software. There is a lot to unpack on this one single screen that shows a lot more than you think....