
Dec 23, 2024 | Articles, Data Dashboards, DataPoint Real-time Screens, Evergreen
In a data-driven world, businesses are increasingly reliant on numbers to narrate their progress and health. Key Performance Indicators (KPIs) serve as the vital signs of an organization’s performance, but numbers alone can’t capture the full story. That...
Nov 27, 2024 | Articles, Data Dashboards, DataPoint Automation, Merge, Reporting
In an era where data is hailed as the new oil, the ability to present this invaluable resource in an understandable, compelling, and visually appealing manner can be the difference between making an impactful connection with your audience or missing the mark entirely....
Nov 20, 2024 | Articles, Data Dashboards, DataPoint Automation, Merge, Reporting
In today’s fast-paced business environment, efficient data management is a critical aspect of success. With the advent of tools like DataPoint, companies are finding powerful solutions for automated data reporting that deliver remarkable improvements in...
Nov 6, 2024 | Articles, Data Dashboards, DataPoint, Reporting
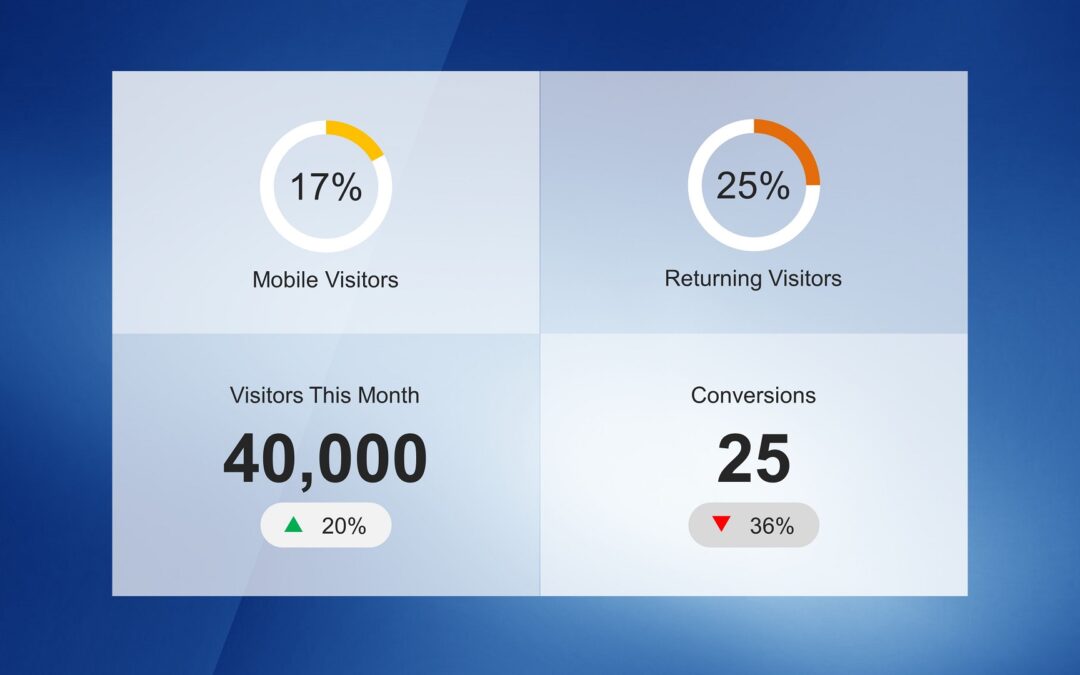
Are you seeking a way to display live data in your PowerPoint presentations dynamically? Look no further! With PresentationPoint’s DataPoint plugin, you can create dashboards in PowerPoint that update in real-time, ensuring your data is as up-to-date as...

Oct 23, 2024 | Articles, Data Dashboards, DataPoint Real-time Screens, Evergreen
In today’s fast-paced business environment, staying ahead of trends and efficiently analyzing operations are crucial for success. Traditional methods of generating reports and presentations, which involve manual data updates and countless hours of compilation,...

Oct 8, 2024 | Articles, Data Dashboards, DataPoint Real-time Screens, Evergreen
In a world where information changes in the blink of an eye, a static presentation can be a relic before it’s even delivered. That’s where DataPoint, our innovative PowerPoint plugin, becomes your secret weapon. DataPoint transforms the way you create and...

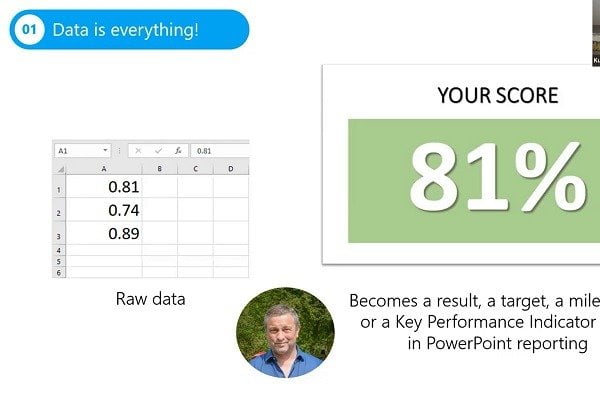
Sep 24, 2024 | Articles, Data Dashboards, Evergreen
In today’s fast-paced business environment, the ability to quickly transform raw data into insightful, actionable intelligence is more than a strategic advantage – it’s a necessity. While spreadsheets have long been the stalwarts of data organization and...

Aug 26, 2024 | Articles, Data Dashboards, DataPoint Automation, Merge, Reporting
In today’s fast-paced world, the ability to make quick, data-driven decisions is a key differentiator between staying ahead or falling behind in any industry. This is why an increasing number of smart businesses are migrating towards automated reporting systems....
Aug 22, 2024 | Articles, Data Dashboards, DataPoint, DataPoint Real-time Screens
Understanding Real-Time Dashboards Real-time dashboards are essential tools for both aviation and automotive sectors, allowing pilots and drivers to monitor crucial key performance indicators (KPIs) such as fuel levels, speed, and engine temperature. This real-time...
Aug 5, 2024 | Articles, Data Dashboards, DataPoint, Evergreen, Reporting
DataPoint is a game-changer for any organization looking to streamline their document creation process, specifically when utilizing PowerPoint. Here are compelling reasons why DataPoint stands out as the best add-in for automating document creation: Real-Time Data...
Jul 23, 2024 | Articles, Data Dashboards, DataPoint, Reporting
Choosing the right tool for data presentation and analysis is crucial in a business environment. While Business Intelligence (BI) tools like Power BI offer comprehensive data analysis and visualization capabilities, there are compelling reasons to consider PowerPoint...

Jul 16, 2024 | Articles, Data Dashboards, DataPoint, Reporting, Scoreboards
When you’re working with data, especially in a professional or business environment, one of the key challenges is ensuring that the information presented to stakeholders is current, clear, and impactful. This is where linking Excel to PowerPoint using DataPoint...

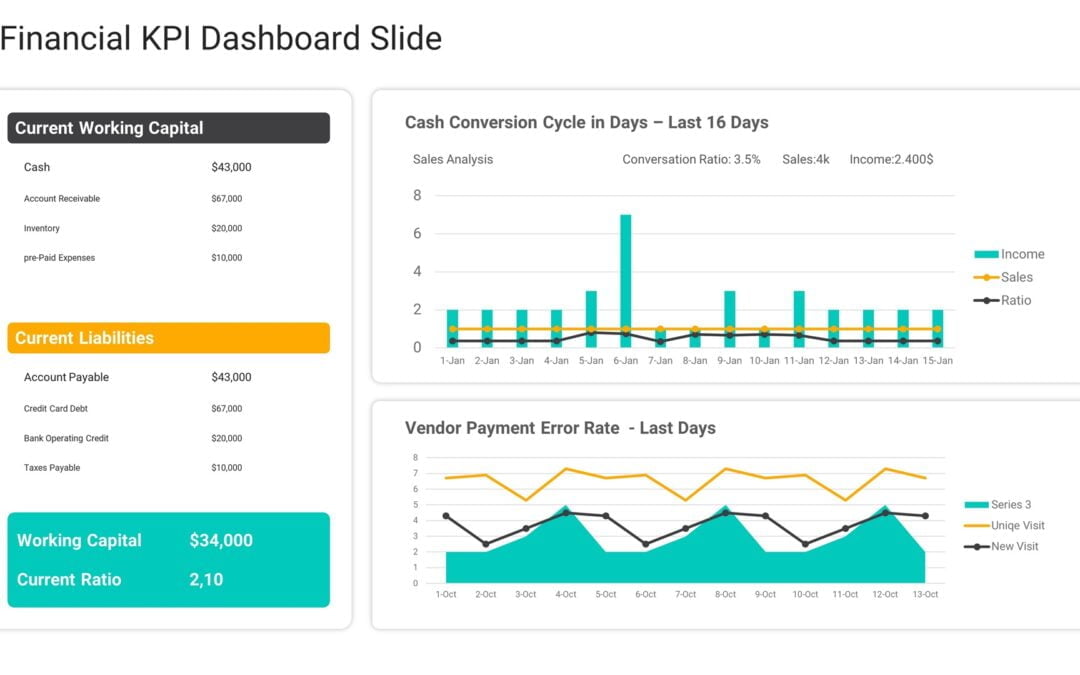
Jul 5, 2024 | Data Dashboards, DataPoint, Financial
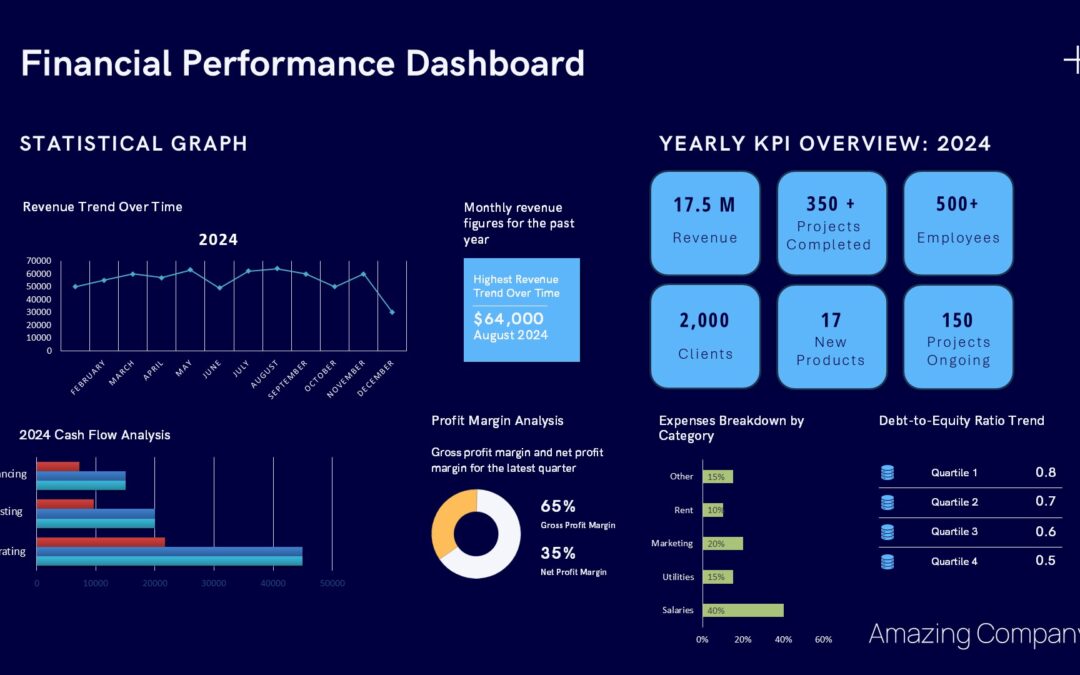
In today’s fast-paced business environment, having access to real-time financial data is crucial for making informed decisions. Financial dashboards provide a visual representation of key business metrics, helping stakeholders monitor performance and identify...
May 9, 2024 | Articles, Data Dashboards, DataPoint, Evergreen, Reporting, Scoreboards
In an age where data drives decisions, business intelligence (BI) tools have become indispensable in extracting insights from vast amounts of data. However, the real challenge lies in communicating these data-driven insights effectively. Presentations, especially...
Apr 29, 2024 | Articles, Data Dashboards, DataPoint
In today’s data-driven business environment, presentations often need to include the latest data for accurate decision-making and compelling storytelling. When that data resides in Excel files on SharePoint, incorporating it into PowerPoint presentations can...
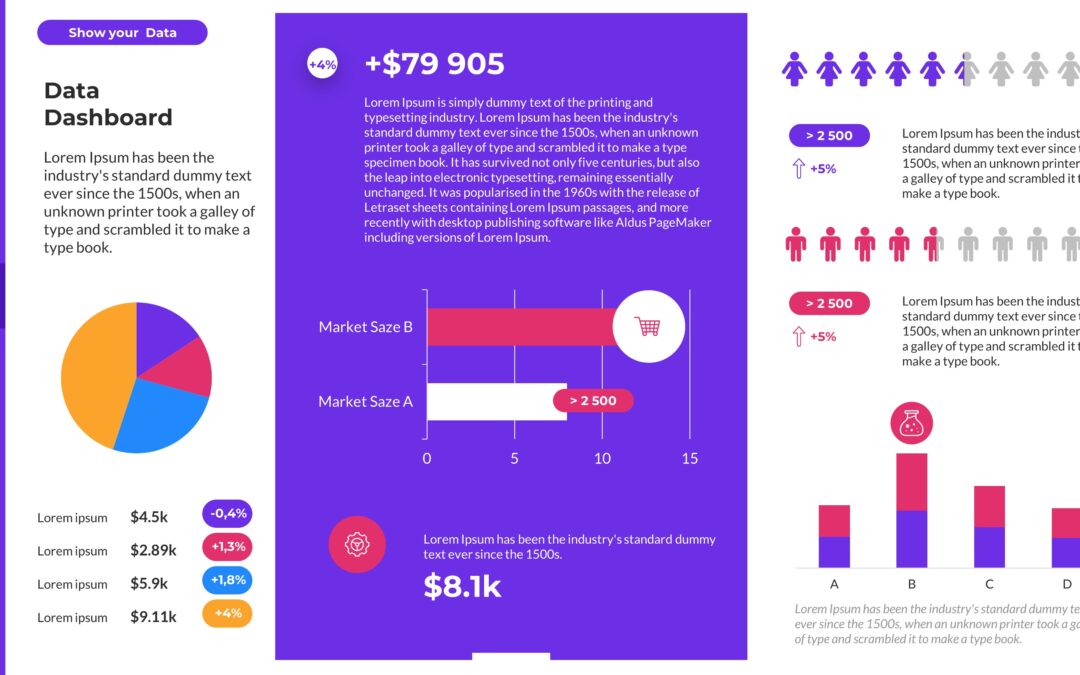
Dec 16, 2023 | Articles, Data Dashboards
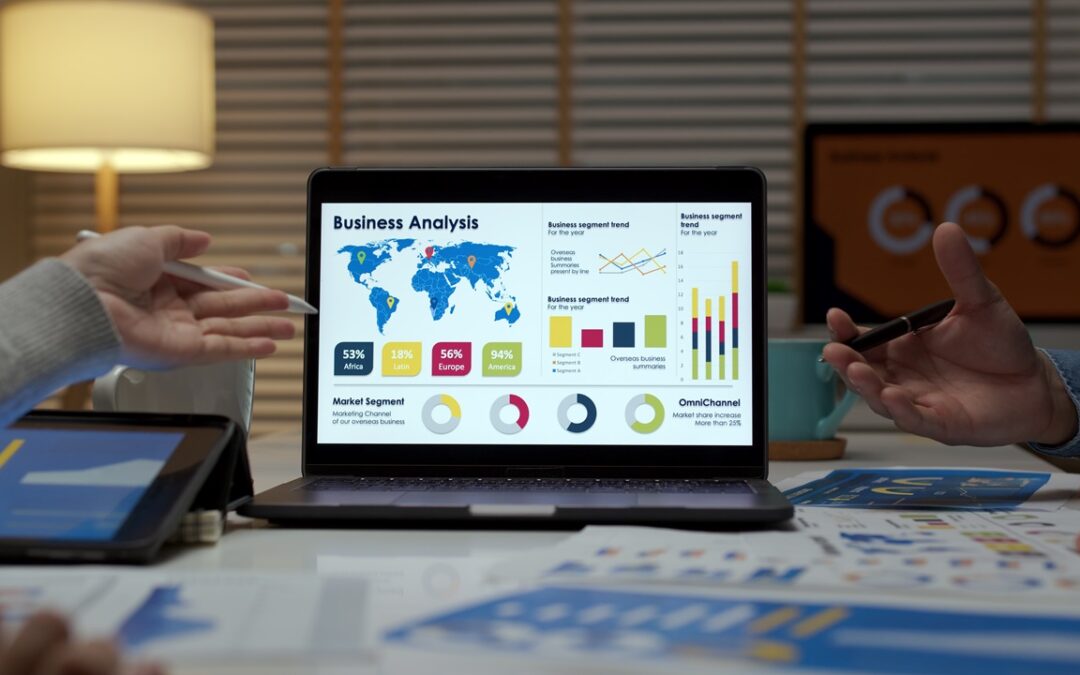
In today’s data-driven world, effective communication of information is key to success. With the rise of big data, businesses and organizations are inundated with information that needs to be analyzed and presented in a clear and concise manner to make informed...

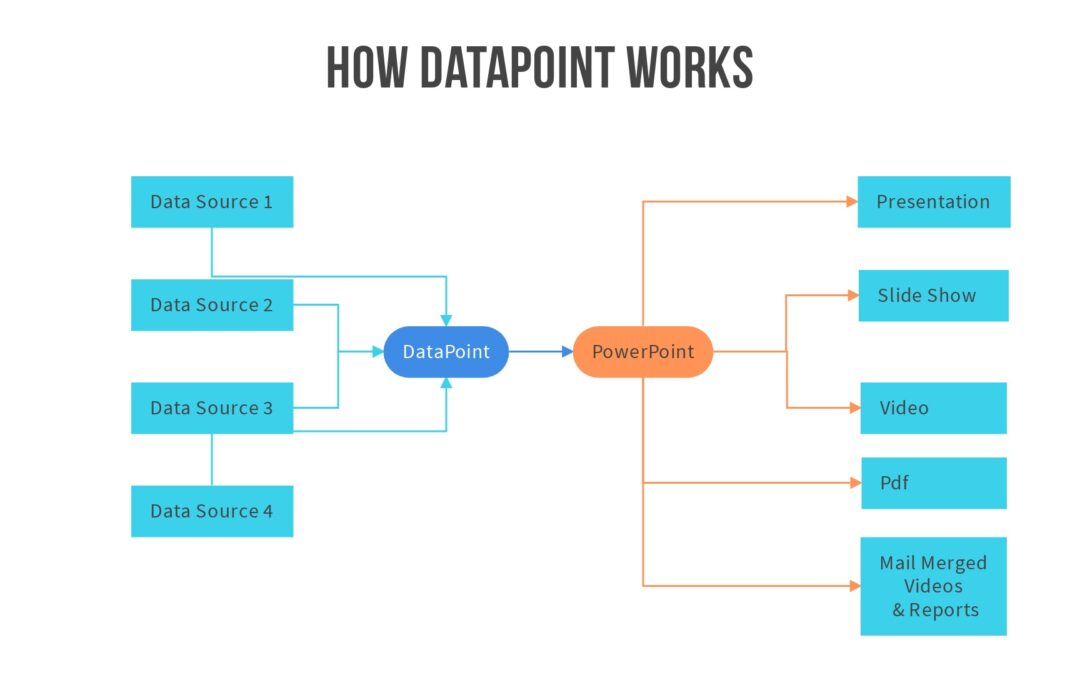
Nov 24, 2023 | Articles, Data Dashboards, DataPoint, DataPoint Automation, Reporting
As a decision-maker in today’s fast-paced, data-driven world, extracting value from your data has never been more important. We understand that dealing with multiple data sources and formats can be challenging. That’s why we’re excited to introduce...

Oct 2, 2023 | Articles, Data Dashboards, DataPoint
In today’s fast-paced business world, effective communication and data visualization are vital for success. When it comes to creating real-time dashboards and dynamic presentations, PowerPoint has long been a popular choice. However, many individuals and...
Jul 11, 2023 | Articles, Data Dashboards, DataPoint, DataPoint Automation, Evergreen
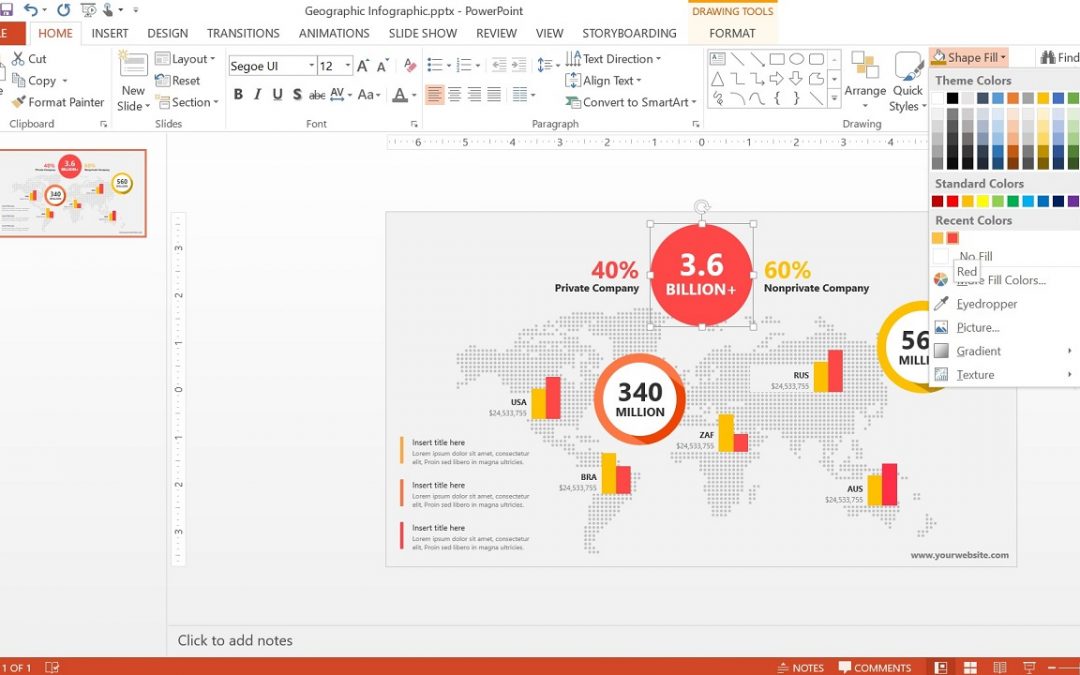
In today’s data-driven world, effective data visualization has become crucial for conveying complex information in a simple and visually appealing format. PowerPoint, with its versatile features, allows users to create impactful presentations incorporating...
Mar 27, 2023 | Data Dashboards, DataPoint, DataPoint Automation, Financial, Reporting
Data is a key component of any business. The information you gather can be used to make important decisions, connect with new customers, and even show off to investors. But what do you do when you have multiple sources of data? How can you combine data from all your...
Mar 2, 2023 | Data Dashboards, DataPoint, Financial, Reporting
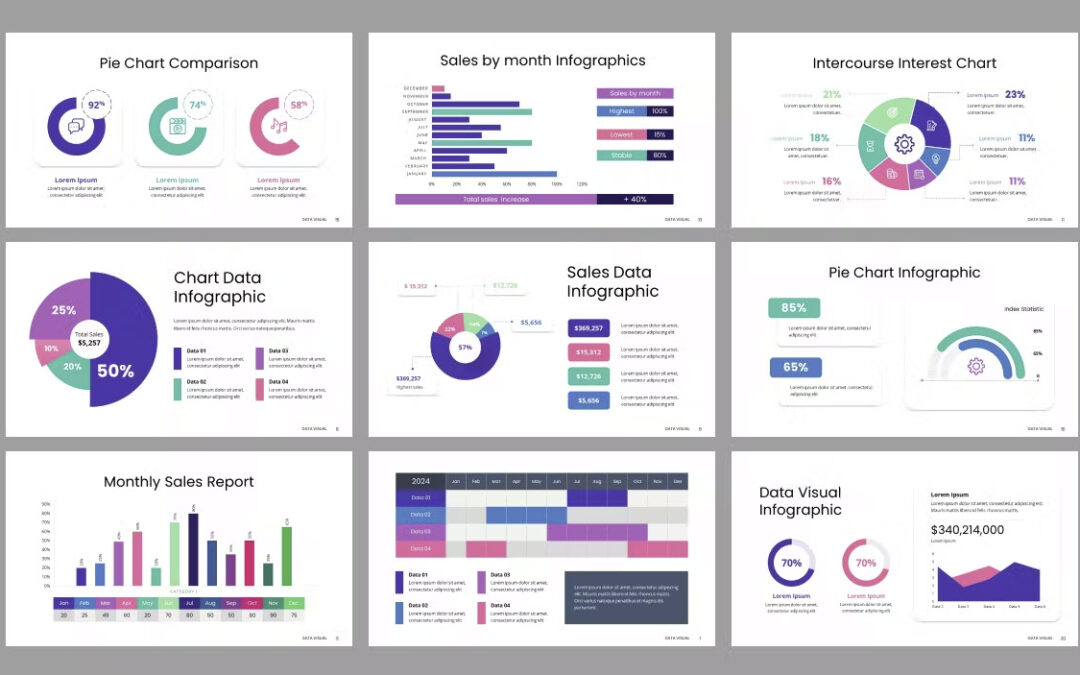
Key Performance Indicators (KPIs) are a great way to measure the performance of your business. They show how you’re doing against your goals and help you keep track of changes over time. KPI templates for a PowerPoint presentation can be used for many different...

Feb 28, 2022 | Articles, Data Dashboards, DataPoint, Healthcare
In this video, we show you how to create a live coronavirus dashboard using PowerPoint and the PowerPoint add-on, DataPoint. Then we break down some of the steps and show how-to screenshots in the article. Find A Coronavirus Dashboard Data Feed The first step is to...

Oct 26, 2021 | Articles, Case Studies, Data Dashboards, DataPoint, DataPoint Real-time Screens, Evergreen, Reporting
The Power of Data Dashboards Wherever your eyesight wanders around, you will see data, and with every step, you will experience the changes it has brought about. For example, if you look in the world of business, data is being used constantly to analyze, innovate,...
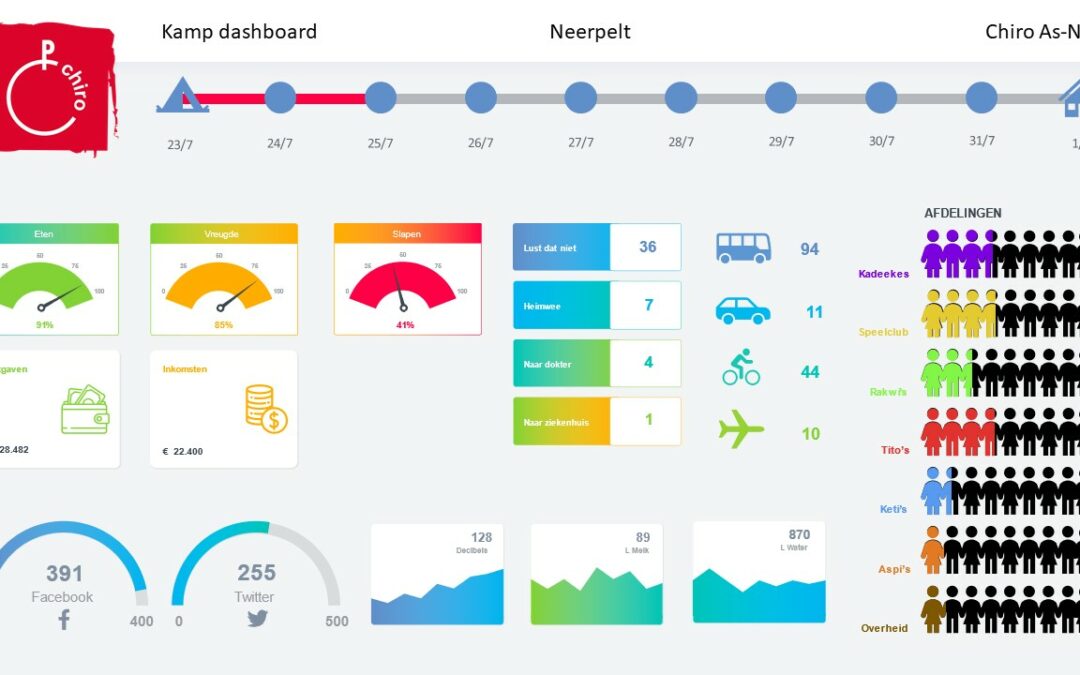
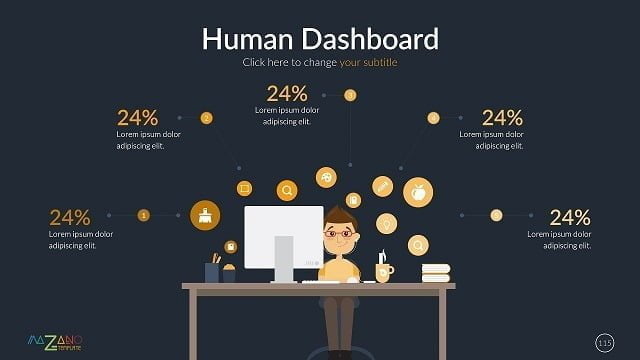
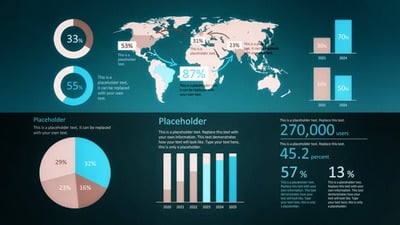
Aug 31, 2021 | Articles, Data Dashboards, Non-profit
Ever wonder what PresentationPoint staff do for vacations? Our founder, Kurt Dupont, donates some of his vacation time to cook for 150+ hungry campers at the nonprofit Chiro Youth Camp. Being Kurt, he came back and created this nonprofit infographic dashboard in...
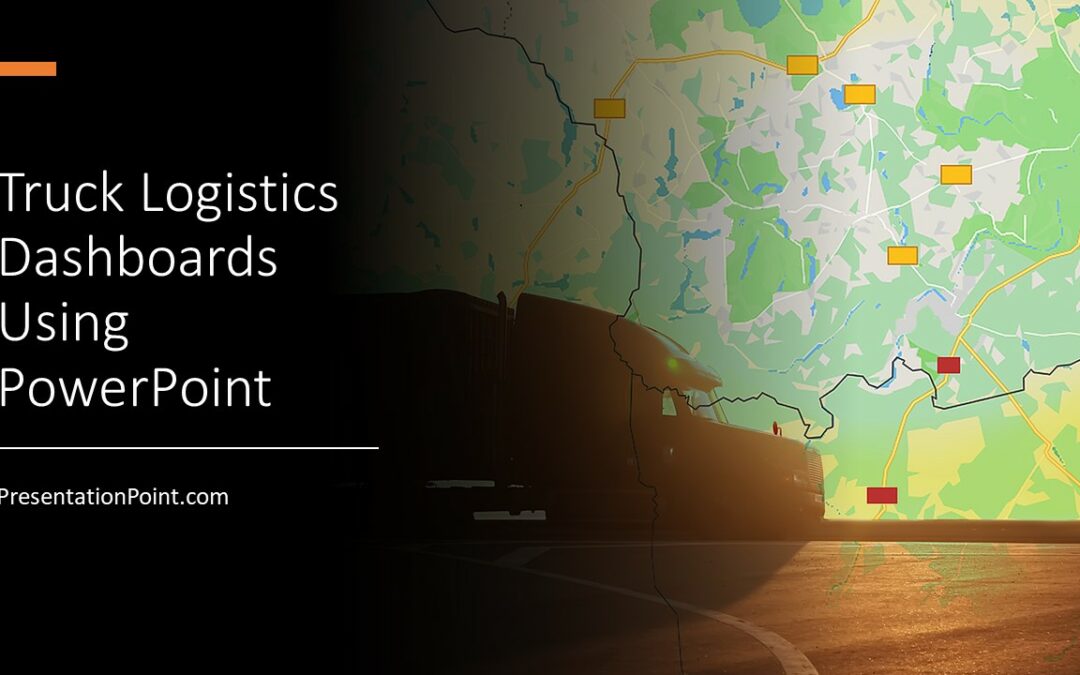
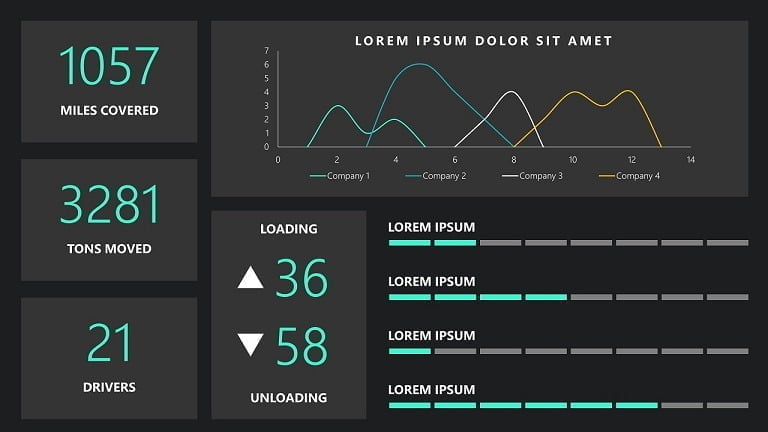
Aug 3, 2021 | Articles, Data Dashboards, DataPoint, DataPoint Real-time Screens, Evergreen, Logistics, Transportation
The trucking industry is a challenging one, with many logistics to manage. In this video, we will show you how to set up a truck logistics dashboard using PowerPoint and our PowerPoint add-on, DataPoint. Why are Truck Logistics Important? Truck logistics dashboards...

Jun 21, 2021 | Articles, Data Dashboards, DataPoint, Evergreen, Financial
In this video, we explore how to create a crypto dashboard in PowerPoint to show real-time pricing of cryptocurrencies. See the video above to see the crypto dashboard in PowerPoint in action. The first step whenever you are creating a data-driven PowerPoint...

Mar 23, 2021 | Case Studies, Data Dashboards, DataPoint, DataPoint Real-time Screens, Evergreen, Interoffice Communication, Reporting
Thanks to Victig Screening Solutions for sharing with us how they are using DataPoint to create their own sales dashboard. About You – Tell us a bit about your company or organization and what you do. VICTIG Screening Solutions offers an intuitive and...
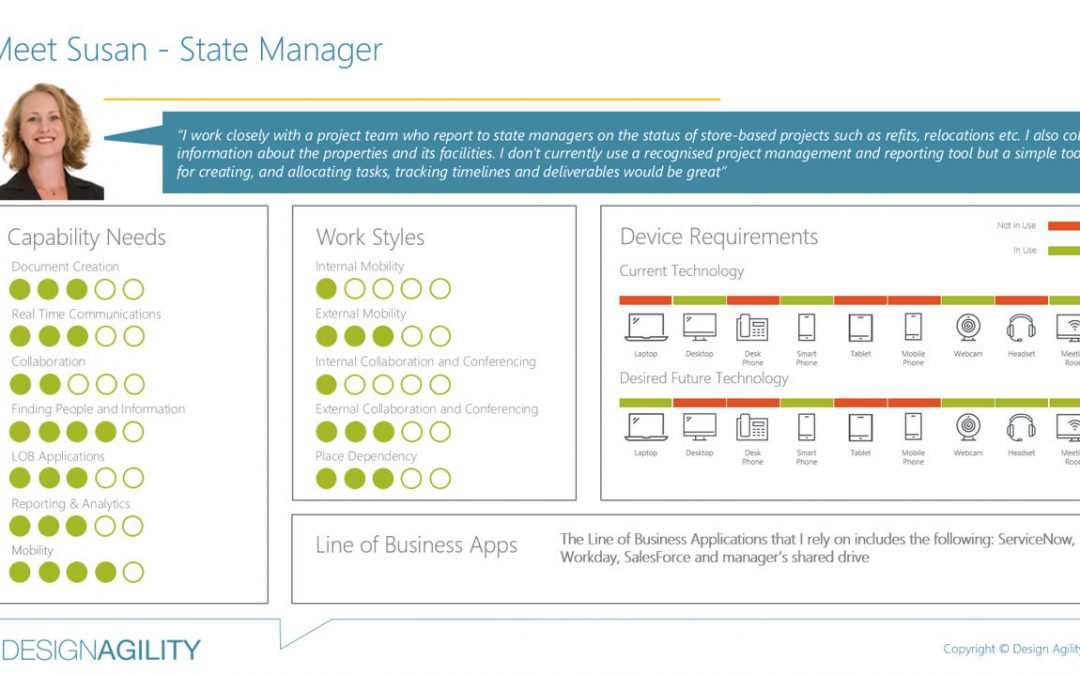
Feb 17, 2021 | Case Studies, Data Dashboards, DataPoint, DataPoint Automation, Evergreen, Human Resources, Reporting
In this video and case study, we share how our reseller partner, Design Agility, created custom data-driven staff profiles to help with their training assessments and implementation. Background Design Agility is a consulting firm in Melbourne Australia. They help...

Dec 14, 2020 | Articles, Case Studies, Data Dashboards, Government, Logistics, Military or Defense, Reporting
PresentationPoint is proud that our software is used in military planning for mission-critical situations needed by people who serve in military organizations. Our software is used by such militaries as the US Air Force and US Army. Recently we created a custom...
Jun 20, 2020 | Articles, Data Dashboards, DataPoint, DataPoint Automation, DataPoint Real-time Screens
As promised, here is a recording of Kurt Dupont’s presentation from our Presentation Ideas Europe 2020 Online Conference, “How to Create Data-Driven Presentations in PowerPoint.” About PresentationPoint Case Studies: How People Use Our Software...

Apr 4, 2020 | Articles, Case Studies, Data Dashboards, DataPoint, Evergreen, Government, iPoint, Reporting
In this video and article, we are going to explore how our software can be used for your smart city project – to make your community or city truly data-driven. Smart City Project Concept What is a Smart City Project? This is a project meant to collect data from...

Mar 28, 2020 | Data Dashboards, DataPoint, DataPoint Real-time Screens, Healthcare
To help with the current coronavirus emergency, we have put together these free coronavirus tips Powerpoint slide templates for you to use. The slides include coronavirus prevention tips, symptoms and instructions on what to do if you have symptoms. Feel free to...

Mar 28, 2020 | Case Studies, Data Dashboards, DataPoint, DataPoint Automation, Evergreen, Financial, Reporting
In this real-life case study, we explore how Hewlett Packard Enterprise uses our DataPoint software for report generating using PowerPoint. The Report Generating Problem Here is a quote from Nicole Mitchell, Customer Experience with Hewlett Packard Enterprise as to...

Feb 28, 2020 | Data Dashboards, DataPoint, DataPoint Real-time Screens, Evergreen, How-To
We recently created this data-driven dashboard in PowerPoint by connecting our presentation to a database with our DataPoint plugin. The result is quite astonishing. The database is basically a dummy, where we have a small utility to execute random updates on the...

Feb 22, 2020 | Articles, Data Dashboards, DataPoint, DataPoint Real-time Screens, Evergreen
OPC defines a revolutionized way of going about industrial processes. OPC, being an aggregation of Object Linking and Embedding for Process Control is currently adopted for use in control processes in smart industries today. In simpler terms, OPC is Open Process...

Dec 20, 2019 | Articles, Case Studies, Data Dashboards, DataPoint, DataPoint Real-time Screens, Digital Signage, Evergreen, Interoffice Communication, iPoint, Reporting
In this article, we will explore how Jo De Saunois of VINCI Energies uses digital information boards created using PresentationPoint to communicate important company and safety information across it’s network of offices in Belgium. The Network of Information...

Dec 12, 2019 | Articles, Data Dashboards, DataPoint Automation, DataPoint Real-time Screens, Tutorials
Here is a recording of Garland Coulson’s presentation from our 2019 Presentation Ideas Conference. Creating KPI Dashboards in PowerPoint You use dashboards every day you drive your car. Your car dashboard monitors speed, fuel, engine temperature and other key...
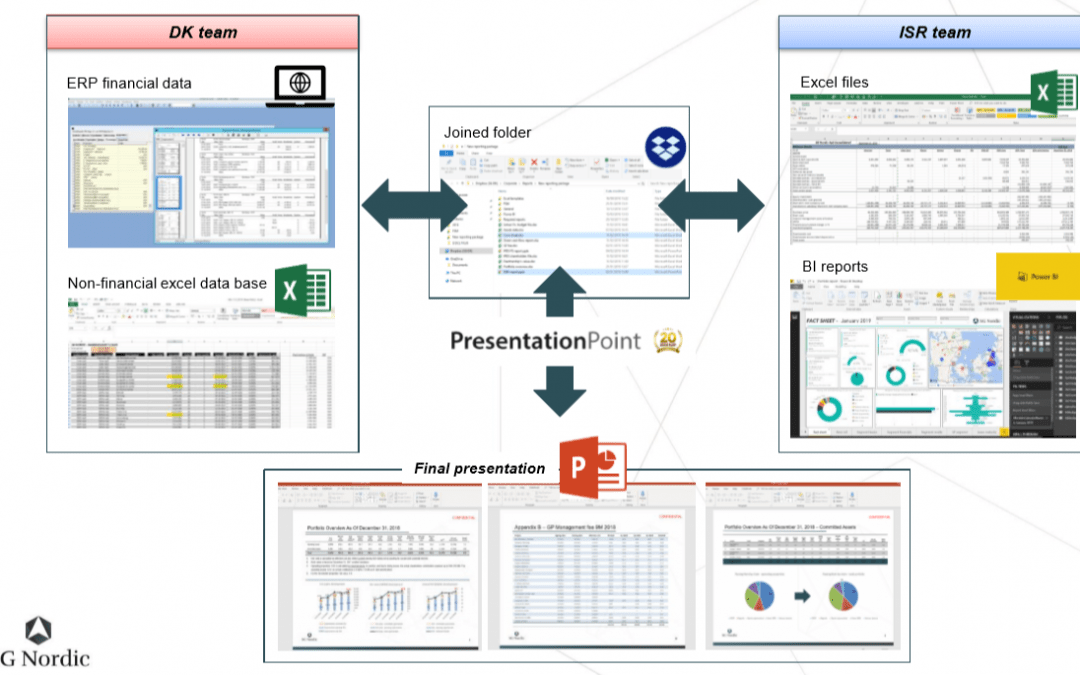
Oct 12, 2019 | Articles, Case Studies, Data Dashboards, DataPoint, DataPoint Automation, Evergreen, Financial, Government, Reporting
In this article and video, we are going to look at a real-life case study showing how PowerPoint can be used as reporting software. Thank you to Chen Buber, CFO of SG Nordic for taking the time to provide us with details of his process and how he is using DataPoint to...
Sep 21, 2019 | Articles, Data Dashboards, DataPoint, DataPoint Automation, DataPoint Real-time Screens
When you work in a warehouse, bank, logistic company, plant, factory, or many others, you most probably work with dashboards. Have you ever met an ugly dashboard? Have you met an information panel that did not inform you, but confused you with the information that it...

Mar 29, 2019 | Articles, Attractions and Events, Case Studies, Data Dashboards, DataPoint Real-time Screens, Digital Signage, Evergreen, Non-profit
In this video we’re going to do a case study for museum digital signage thanks to our client, The Wild Center who agreed to provide us with information about how they’re using our tools and products to set up their museum digital signage. Here are the...
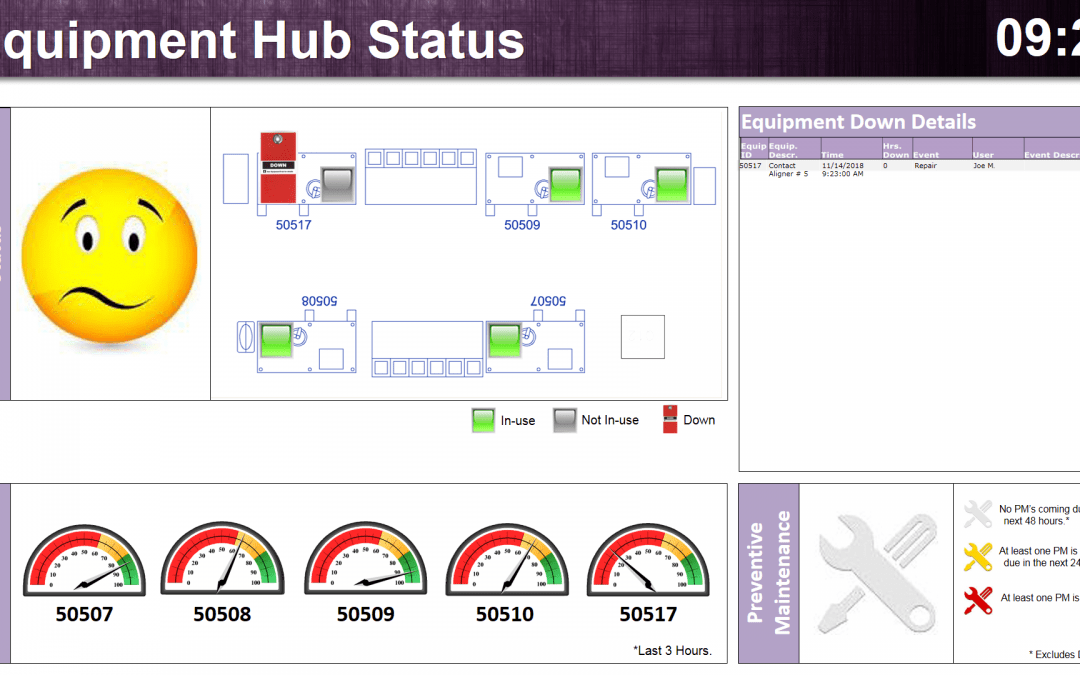
Mar 2, 2019 | Case Studies, Data Dashboards, DataPoint, DataPoint Real-time Screens, Evergreen, How-To, Industrial/Manufacturing, Maps, Reporting
Recently one of our customers who wishes to remain anonymous sent us a screenshot of how they set up an equipment monitoring system dashboard system using our software. There is a lot to unpack on this one single screen that shows a lot more than you think....

Feb 16, 2019 | Articles, Aviation, Case Studies, Data Dashboards, DataPoint, DataPoint Real-time Screens, Digital Signage, Dynamic elements, Evergreen
Here is how Air Tindi, an airline based in Canada’s far North uses digital signage for airline schedules and communicating with customers. Question: Tell us a bit about your company or organization or what you do. Answer:30 years of service and a Northern Based...
Dec 1, 2018 | Articles, Data Dashboards, DataPoint, DataPoint Automation
PowerPoint presentations are very time efficient and effective. Not only do they erase the burden of having to read a large chunk of text, they also afford you the opportunity to see the most important information instantly. With PowerPoint, data can be presented...
Jul 29, 2018 | Articles, Data Dashboards, DataPoint, DataPoint Automation
When you work with a lot of data, it is really boring to stare on the huge sheets of numbers in Excel or similar software. It is much better to visualize the information and present it in a form of chart, graphs or infographics – like logistics dashboards. No...
May 13, 2018 | Case Studies, Data Dashboards, DataPoint, DataPoint Real-time Screens, Evergreen, Industrial/Manufacturing, Reporting
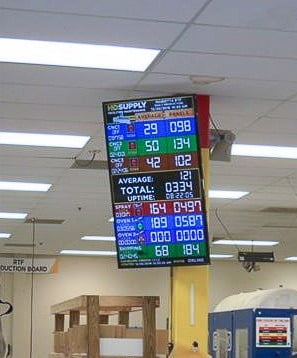
Today we look at a real life case study how one of our customers uses our software to create a custom KPI dashboard. A KPI dashboard is where you use software to report your key performance indicators (KPIs) in real time. HD Supply Holdings Inc. is one of the largest...
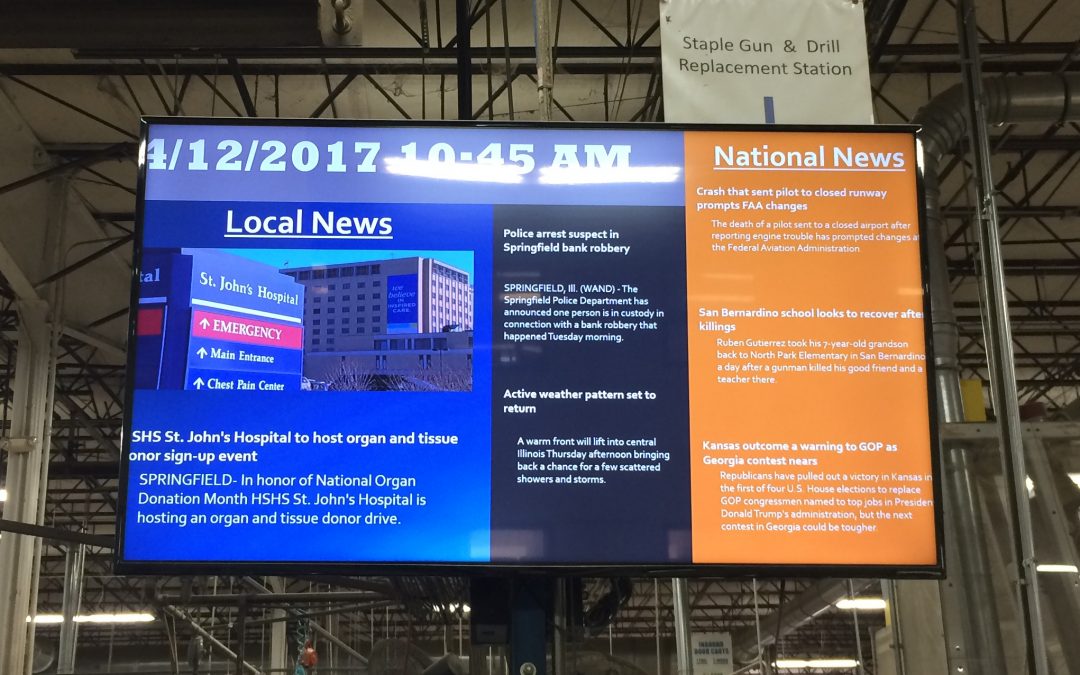
Apr 8, 2018 | Case Studies, Data Dashboards, DataPoint Real-time Screens, Digital Signage, Industrial/Manufacturing, Interoffice Communication, Reporting
MasterBrand is a cabinet manufacturing company headquartered in Jasper, Indiana in the United States with over 20 manufacturing locations in smaller towns across the US and Canada. Their products are carried by over 9,000 dealers in North America. MasterBrand uses...

Jan 28, 2018 | Data Dashboards, DataPoint, DataPoint Automation, DataPoint Real-time Screens
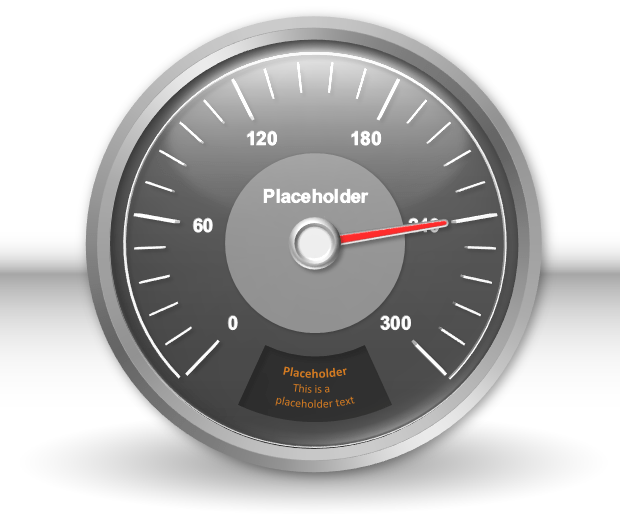
A PowerPoint dashboard with real-time data on gauges is very easy to build with the DataPoint for PowerPoint add-on. Use DataPoint to connect your Microsoft PowerPoint presentation to a data source of your choice. Often databases and spreadsheets are used. Let’s...

Aug 14, 2017 | Articles, Data Dashboards, DataPoint, DataPoint Automation, DataPoint Real-time Screens, Evergreen
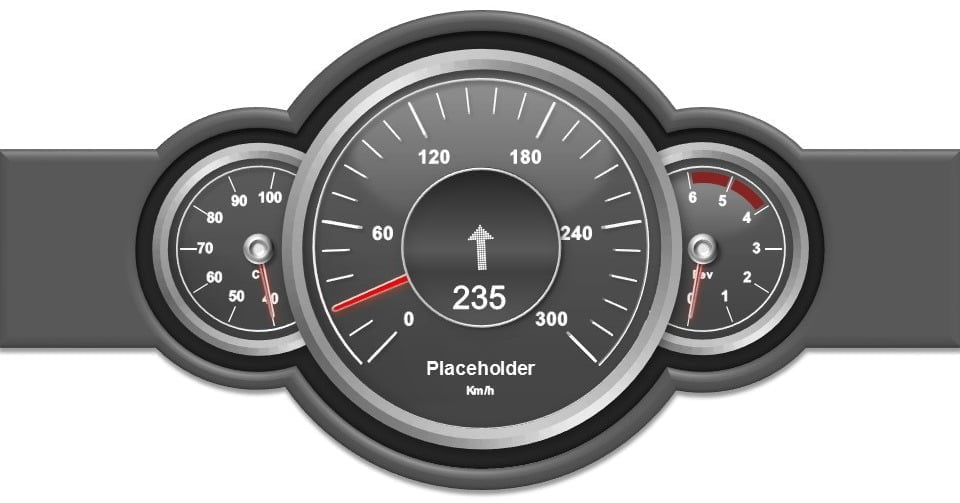
Audiences get bored with old style bar graph and pie charts. So we have created a free PowerPoint Dashboard Speedometer Template for you to use instead. Since most people drive or have ridden in vehicles, people are used to car dashboards as a fast way of getting...
Jul 3, 2017 | Data Dashboards, DataPoint Automation, DataPoint Real-time Screens, How-To
PowerPoint is a popular software program that is included with most versions of Microsoft Office. Most people use PowerPoint to create presentations and to show charts and graphs. However, PowerPoint can be used for so much more than just these things. PowerPoint...
Sep 23, 2016 | Articles, Data Dashboards, DataPoint, DataPoint Real-time Screens
A car’s dashboard gives you vital up-to-date information about your car’s performance. Similarly, a manufacturing KPI dashboard gives you a visual, at-a-glance method, of monitoring your manufacturing Key Performance Indicators. There are hundreds of...
Jun 27, 2016 | Articles, Data Dashboards, DataPoint, DataPoint Automation, DataPoint Real-time Screens, How-To
https://youtu.be/e8JGiYLzNPk KPI dashboards are becoming increasing important to companies and organizations because they let management see key performance indicators as to the health and processes at a glance. In this video/article, we will show you how to...
May 18, 2016 | Articles, Case Studies, Data Dashboards, DataPoint, DataPoint Automation, How-To, Industrial/Manufacturing, Reporting
Our clients are extremely creative and come up with ways to use our products that often astonish us. So we thought we would share some case studies as to how our clients make real-life use of our software tools within their businesses or organization. Today, we are...

Nov 24, 2015 | Articles, Attractions and Events, Case Studies, Data Dashboards, DataPoint, DataPoint Real-time Screens, Financial, Reporting, Scoreboards
Critical data driven television output Most, if not all, auction houses use data driven presentations, like here on this image, a recent record-breaking auction at Sotheby’s. With a data driven and, more important, real-time presentation, you can display bidding...
Mar 9, 2015 | Data Dashboards, DataPoint, DataPoint Real-time Screens, How-To
Dashboards are great to visualize information. Think about the dashboard in a car. The speedometer there immediately gives a graphical indication of the speed. In a glance the user will see if driving too fast. Link for dynamic data The user can create similar digital...

Jan 15, 2015 | Aviation, Case Studies, Data Dashboards, DataPoint Real-time Screens, Maps
DataPoint powers iFlight Simulator located at Disneyland Paris and Paris itself. iFlight Simulator let the user experience what it is like to fly a modern Jetliner in an Airbus A320 simulator. The user can take off and land to any of over 24 000 airports around the...


