Nov 27, 2024 | Articles, Data Dashboards, DataPoint Automation, Merge, Reporting
In an era where data is hailed as the new oil, the ability to present this invaluable resource in an understandable, compelling, and visually appealing manner can be the difference between making an impactful connection with your audience or missing the mark entirely....
Nov 20, 2024 | Articles, Data Dashboards, DataPoint Automation, Merge, Reporting
In today’s fast-paced business environment, efficient data management is a critical aspect of success. With the advent of tools like DataPoint, companies are finding powerful solutions for automated data reporting that deliver remarkable improvements in...
Nov 6, 2024 | Articles, Data Dashboards, DataPoint, Reporting
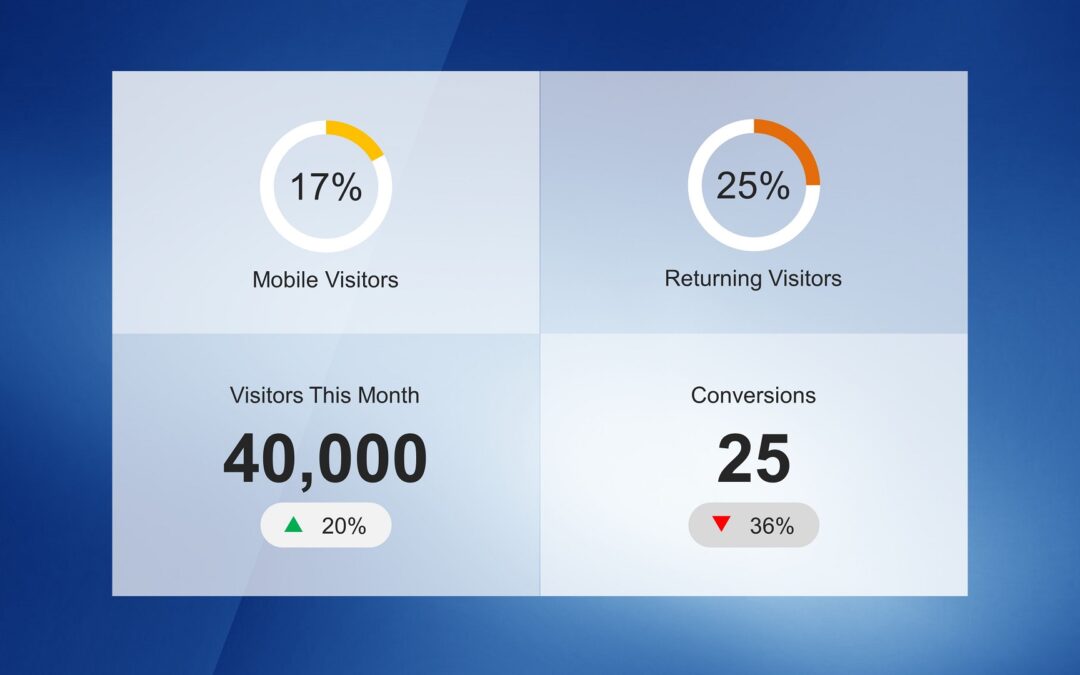
Are you seeking a way to display live data in your PowerPoint presentations dynamically? Look no further! With PresentationPoint’s DataPoint plugin, you can create dashboards in PowerPoint that update in real-time, ensuring your data is as up-to-date as...
Sep 9, 2024 | Articles, Evergreen, Reporting
The landscape of documentation is undergoing a seismic shift as we sail into the digital future. Businesses and individuals alike are constantly seeking more efficient ways to create, manage, and distribute documents. Automated document makers, particularly those...

Sep 2, 2024 | Articles, Evergreen, Reporting
In a data-driven era, the ability to communicate complex information effectively is vital. Enter Data Storytelling, an engaging approach that combines the persuasive power of narratives with the robust evidence of data. With the right tools, such as PowerPoint and the...

Aug 26, 2024 | Articles, Data Dashboards, DataPoint Automation, Merge, Reporting
In today’s fast-paced world, the ability to make quick, data-driven decisions is a key differentiator between staying ahead or falling behind in any industry. This is why an increasing number of smart businesses are migrating towards automated reporting systems....
Aug 5, 2024 | Articles, Data Dashboards, DataPoint, Evergreen, Reporting
DataPoint is a game-changer for any organization looking to streamline their document creation process, specifically when utilizing PowerPoint. Here are compelling reasons why DataPoint stands out as the best add-in for automating document creation: Real-Time Data...
Jul 23, 2024 | Articles, Data Dashboards, DataPoint, Reporting
Choosing the right tool for data presentation and analysis is crucial in a business environment. While Business Intelligence (BI) tools like Power BI offer comprehensive data analysis and visualization capabilities, there are compelling reasons to consider PowerPoint...

Jul 16, 2024 | Articles, Data Dashboards, DataPoint, Reporting, Scoreboards
When you’re working with data, especially in a professional or business environment, one of the key challenges is ensuring that the information presented to stakeholders is current, clear, and impactful. This is where linking Excel to PowerPoint using DataPoint...
Jul 2, 2024 | Articles, DataPoint, Reporting
In today’s data-driven business environment, the ability to quickly generate documents and presentations that reflect the most current data is not just an advantage; it’s a necessity. Our DataPoint plugin stands out as a powerful solution for automating and...
Jun 26, 2024 | Articles, DataPoint, Financial, Reporting
In the fast-paced financial sector, where data drives decisions and accurate, up-to-the-minute information is non-negotiable, the ability to efficiently generate documents and presentations with the latest data is crucial. PresentationPoint’s DataPoint software...

Jun 19, 2024 | Articles, DataPoint, Reporting
In the age of rapid information exchange and dynamic data landscapes, keeping presentations up-to-date can be a daunting task. Whether you’re delivering quarterly sales results, monitoring real-time data feeds, or sharing the latest metrics with stakeholders,...

Jun 12, 2024 | Articles, DataPoint, Reporting
A question at our PresentationPoint office popped up: how many PowerPoint presentations are made on a daily basis worldwide?? PP PowerPoint, Microsoft’s seminal presentation software, has not only become ubiquitous in corporate offices and educational...
Jun 5, 2024 | Articles, DataPoint, Reporting
In today’s fast-paced business world, generating accurate and up-to-date presentations and documents in bulk has become a paramount need for organizations across the globe. Whether it’s for financial reports, marketing material, or corporate...

May 29, 2024 | Articles, DataPoint, Financial, Reporting
Financial document automation facilitated by DataPoint works by enabling the seamless integration and real-time presentation of financial data within PowerPoint presentations, digital signage, and other documents. Here’s a breakdown of how it operates. 1. Create...
May 22, 2024 | Articles, DataPoint, Reporting
In the fast-paced business world, efficiency in document generation is crucial. Organizations across various industries strive to streamline this process to enhance productivity, reduce human errors, and improve response times. One powerful tool that is...

May 15, 2024 | Articles, DataPoint, Reporting
A question at our PresentationPoint office popped up: how much time is spent to keep presentations up-to-date? PP Calculating a precise estimate for the total number of hours spent updating presentation data worldwide annually is challenging due to several variables,...
May 9, 2024 | Articles, Data Dashboards, DataPoint, Evergreen, Reporting, Scoreboards
In an age where data drives decisions, business intelligence (BI) tools have become indispensable in extracting insights from vast amounts of data. However, the real challenge lies in communicating these data-driven insights effectively. Presentations, especially...

Feb 15, 2024 | Articles, DataPoint, Reporting
In this article, we explore the topic of executive summary PowerPoint presentations, what they are, why they are important, and how to automate their creation. What are Executive Summary PowerPoint Presentations? An executive summary PowerPoint presentation is a brief...
Jan 26, 2024 | Articles, DataPoint, Reporting
In today’s fast-paced business environment, generating PowerPoint reports manually can be a time-consuming and error-prone task. Fortunately, automation offers a solution to streamline this process, allowing you to focus on valuable insights rather than tedious...

Nov 24, 2023 | Articles, Data Dashboards, DataPoint, DataPoint Automation, Reporting
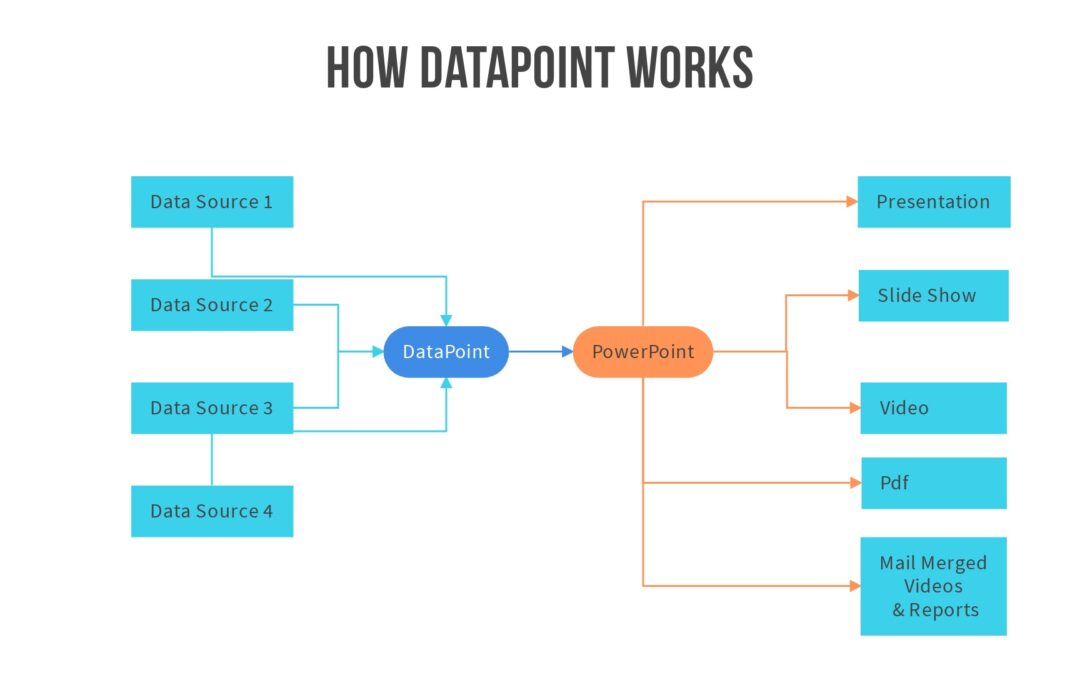
As a decision-maker in today’s fast-paced, data-driven world, extracting value from your data has never been more important. We understand that dealing with multiple data sources and formats can be challenging. That’s why we’re excited to introduce...
Mar 27, 2023 | Data Dashboards, DataPoint, DataPoint Automation, Financial, Reporting
Data is a key component of any business. The information you gather can be used to make important decisions, connect with new customers, and even show off to investors. But what do you do when you have multiple sources of data? How can you combine data from all your...
Mar 2, 2023 | Data Dashboards, DataPoint, Financial, Reporting
Key Performance Indicators (KPIs) are a great way to measure the performance of your business. They show how you’re doing against your goals and help you keep track of changes over time. KPI templates for a PowerPoint presentation can be used for many different...

Oct 4, 2022 | Articles, Broadcasting, Case Studies, DataPoint, Elections, Government, Reporting
In this article, we discuss how Robertson County Government in Tennessee in the US used DataPoint to create their own election dashboard software for their election viewing party. A big thank you to Chet Biggers, IT Manager for Robertson Country for sharing this story...

Oct 26, 2021 | Articles, Case Studies, Data Dashboards, DataPoint, DataPoint Real-time Screens, Evergreen, Reporting
The Power of Data Dashboards Wherever your eyesight wanders around, you will see data, and with every step, you will experience the changes it has brought about. For example, if you look in the world of business, data is being used constantly to analyze, innovate,...

Mar 23, 2021 | Case Studies, Data Dashboards, DataPoint, DataPoint Real-time Screens, Evergreen, Interoffice Communication, Reporting
Thanks to Victig Screening Solutions for sharing with us how they are using DataPoint to create their own sales dashboard. About You – Tell us a bit about your company or organization and what you do. VICTIG Screening Solutions offers an intuitive and...
Feb 17, 2021 | Case Studies, Data Dashboards, DataPoint, DataPoint Automation, Evergreen, Human Resources, Reporting
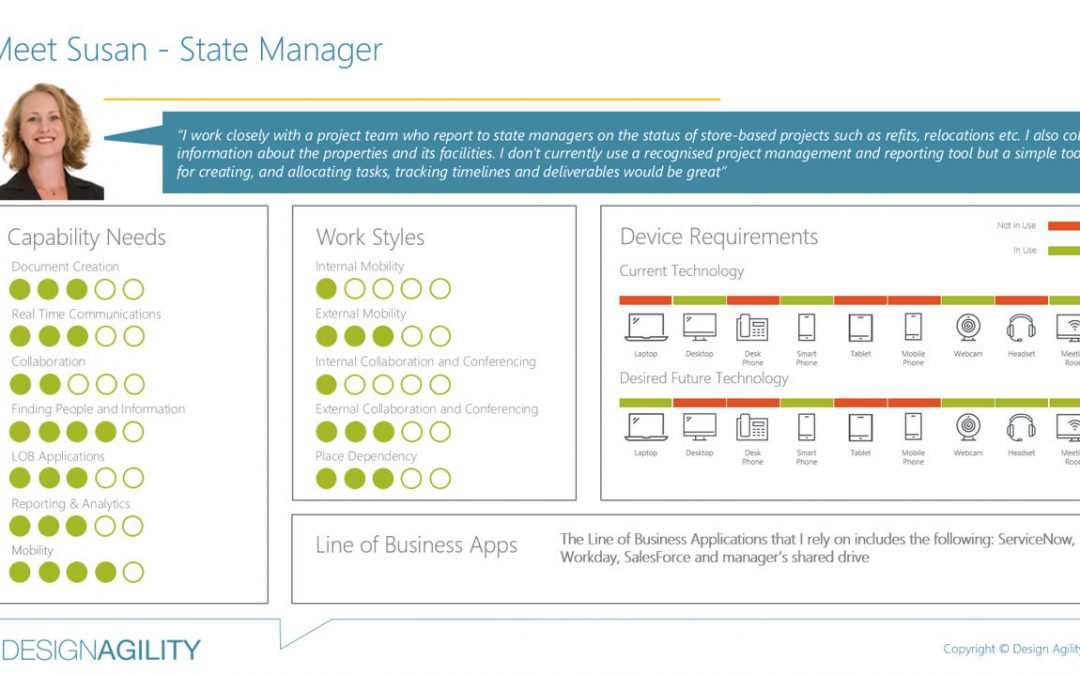
In this video and case study, we share how our reseller partner, Design Agility, created custom data-driven staff profiles to help with their training assessments and implementation. Background Design Agility is a consulting firm in Melbourne Australia. They help...

Dec 14, 2020 | Articles, Case Studies, Data Dashboards, Government, Logistics, Military or Defense, Reporting
PresentationPoint is proud that our software is used in military planning for mission-critical situations needed by people who serve in military organizations. Our software is used by such militaries as the US Air Force and US Army. Recently we created a custom...

Apr 4, 2020 | Articles, Case Studies, Data Dashboards, DataPoint, Evergreen, Government, iPoint, Reporting
In this video and article, we are going to explore how our software can be used for your smart city project – to make your community or city truly data-driven. Smart City Project Concept What is a Smart City Project? This is a project meant to collect data from...

Mar 28, 2020 | Case Studies, Data Dashboards, DataPoint, DataPoint Automation, Evergreen, Financial, Reporting
In this real-life case study, we explore how Hewlett Packard Enterprise uses our DataPoint software for report generating using PowerPoint. The Report Generating Problem Here is a quote from Nicole Mitchell, Customer Experience with Hewlett Packard Enterprise as to...

Dec 20, 2019 | Articles, Case Studies, Data Dashboards, DataPoint, DataPoint Real-time Screens, Digital Signage, Evergreen, Interoffice Communication, iPoint, Reporting
In this article, we will explore how Jo De Saunois of VINCI Energies uses digital information boards created using PresentationPoint to communicate important company and safety information across it’s network of offices in Belgium. The Network of Information...

Dec 6, 2019 | Articles, DataPoint, DataPoint Automation, DataPoint Real-time Screens, How-To, Reporting, Tutorials
Here is a recording of Kurt Dupont’s presentation at our Presentation Ideas 2019 Online Conference. Generating Reports Using PowerPoint When you think of business reports, you probably think of Microsoft Excel or Microsoft Word, not PowerPoint. If so, you are...
Oct 12, 2019 | Articles, Case Studies, Data Dashboards, DataPoint, DataPoint Automation, Evergreen, Financial, Government, Reporting
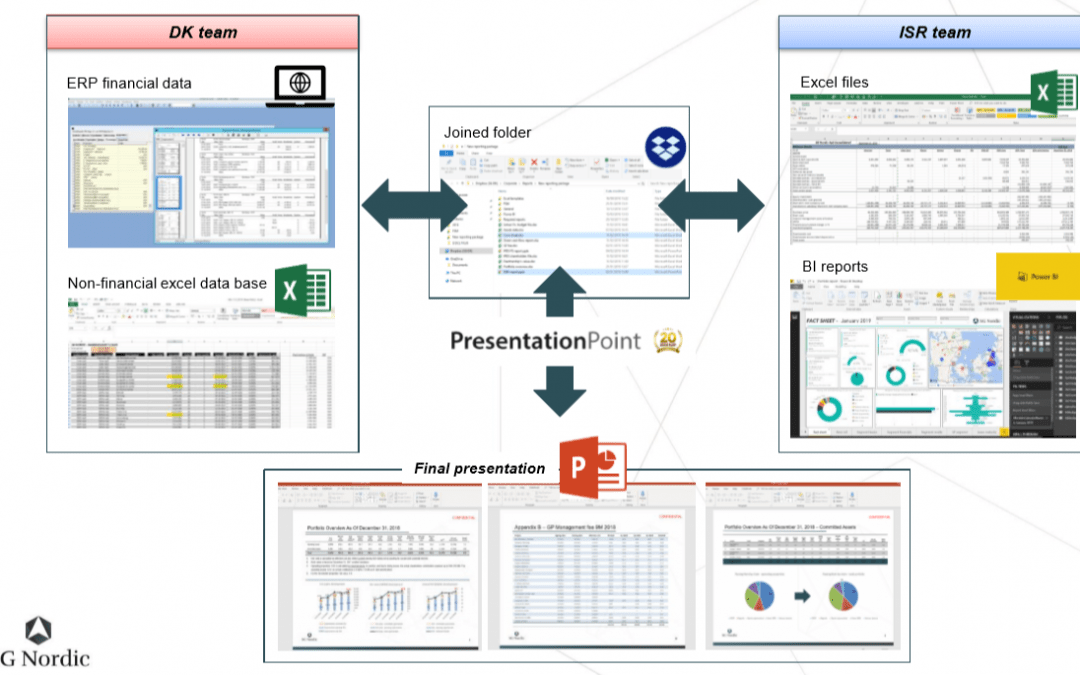
In this article and video, we are going to look at a real-life case study showing how PowerPoint can be used as reporting software. Thank you to Chen Buber, CFO of SG Nordic for taking the time to provide us with details of his process and how he is using DataPoint to...

Aug 17, 2019 | Articles, DataPoint, DataPoint Automation, Reporting
The best way to achieve effectiveness in business reporting is the direct approach. If you want to pass your points across to stakeholders and get them to listen, appreciate and enforce, you must be clear, simple and direct. When presenting a report, you must arrange...
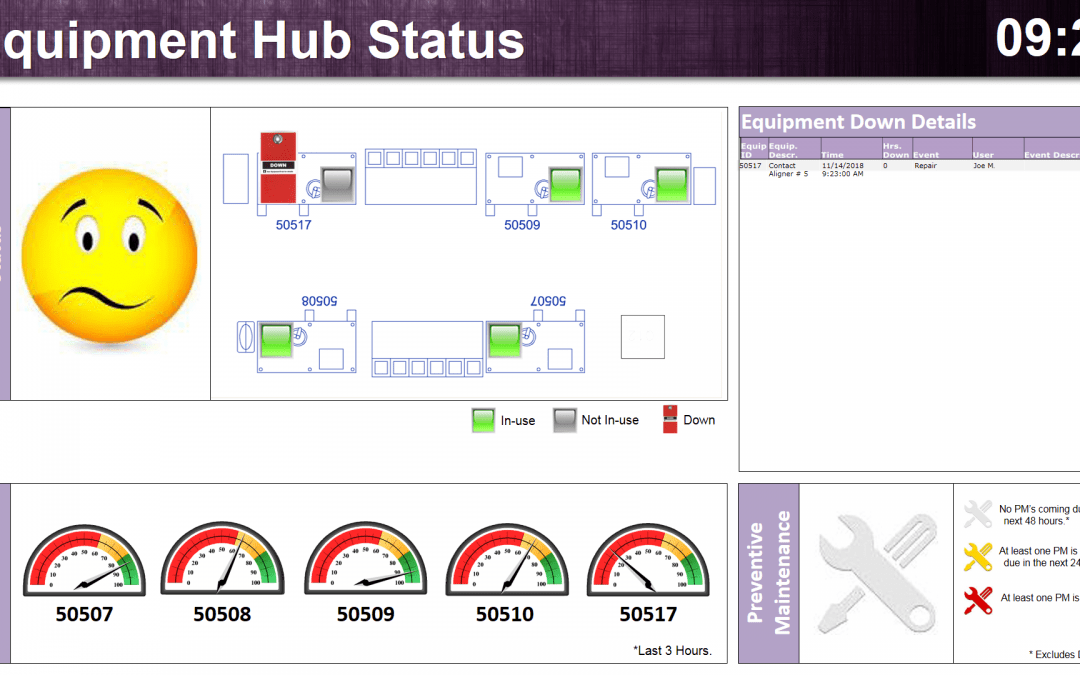
Mar 2, 2019 | Case Studies, Data Dashboards, DataPoint, DataPoint Real-time Screens, Evergreen, How-To, Industrial/Manufacturing, Maps, Reporting
Recently one of our customers who wishes to remain anonymous sent us a screenshot of how they set up an equipment monitoring system dashboard system using our software. There is a lot to unpack on this one single screen that shows a lot more than you think....
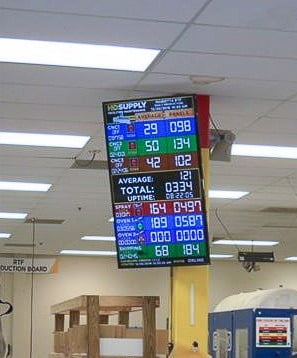
May 13, 2018 | Case Studies, Data Dashboards, DataPoint, DataPoint Real-time Screens, Evergreen, Industrial/Manufacturing, Reporting
Today we look at a real life case study how one of our customers uses our software to create a custom KPI dashboard. A KPI dashboard is where you use software to report your key performance indicators (KPIs) in real time. HD Supply Holdings Inc. is one of the largest...
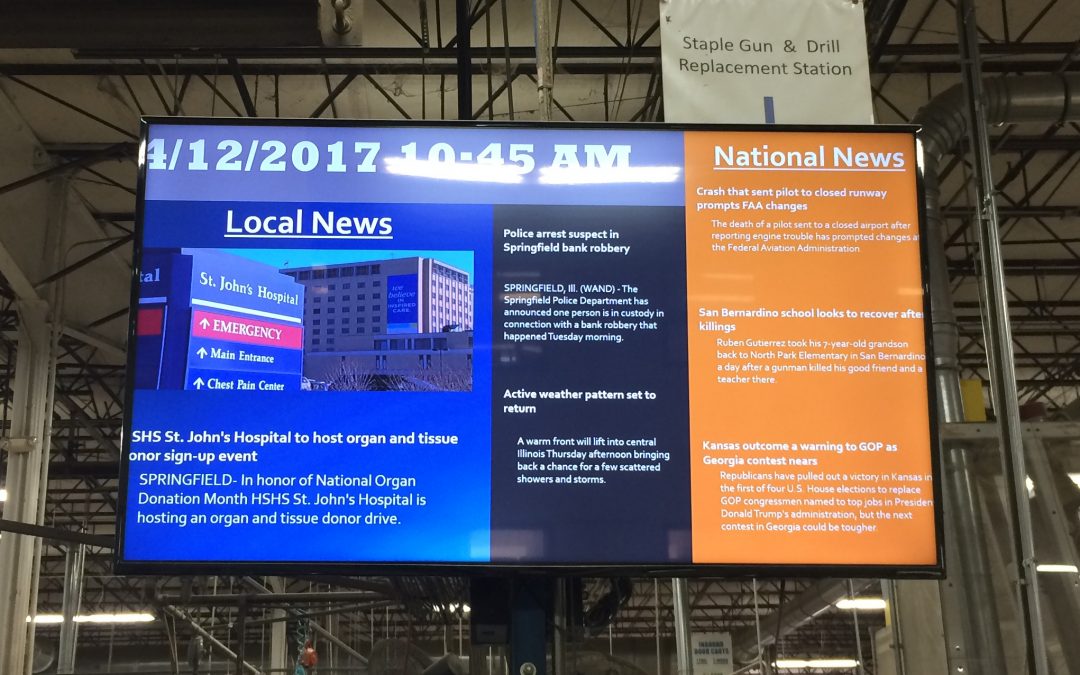
Apr 8, 2018 | Case Studies, Data Dashboards, DataPoint Real-time Screens, Digital Signage, Industrial/Manufacturing, Interoffice Communication, Reporting
MasterBrand is a cabinet manufacturing company headquartered in Jasper, Indiana in the United States with over 20 manufacturing locations in smaller towns across the US and Canada. Their products are carried by over 9,000 dealers in North America. MasterBrand uses...

Mar 11, 2018 | Case Studies, Evergreen, Financial, Reporting
Our favorite thing of all is to find out how our customers are using our software. Our customers are amazingly creative and often come up with uses for our software we hadn’t thought of. In this article, we interview our customer Kevin Galandy, President...
Aug 2, 2017 | Case Studies, DataPoint, DataPoint Real-time Screens, Industrial/Manufacturing, Reporting
Still DataPoint crushes the competition for ease of use and deployability. We use Intel Compute Sticks connected to 55 inch screens in different modes and flavors… It’s AMAZING to see how creative we can get when creating new Digital Signage… and the...

May 18, 2016 | Articles, Case Studies, Data Dashboards, DataPoint, DataPoint Automation, How-To, Industrial/Manufacturing, Reporting
Our clients are extremely creative and come up with ways to use our products that often astonish us. So we thought we would share some case studies as to how our clients make real-life use of our software tools within their businesses or organization. Today, we are...

Mar 15, 2016 | Case Studies, DataPoint Automation, Merge, Reporting
I’m so fortunate to have stumbled upon DataPoint offered by PresentationPoint. My problem was that I needed to create a product sales catalog where prices and products offered change seasonally. This information was best organized in a spreadsheet in Excel. My...

Nov 24, 2015 | Articles, Attractions and Events, Case Studies, Data Dashboards, DataPoint, DataPoint Real-time Screens, Financial, Reporting, Scoreboards
Critical data driven television output Most, if not all, auction houses use data driven presentations, like here on this image, a recent record-breaking auction at Sotheby’s. With a data driven and, more important, real-time presentation, you can display bidding...


