Our clients are extremely creative and come up with ways to use our products that often astonish us. So we thought we would share some case studies as to how our clients make real-life use of our software tools within their businesses or organization. Today, we are going to discuss how Lundins uses our software to create their own custom manufacturing KPI dashboard.
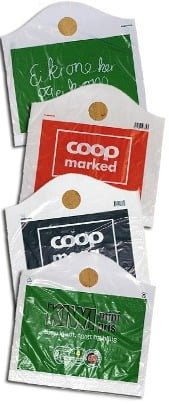
 Lundins is a manufacturing unit with the Trioplast Group in Sweden. The Trioplast Group has over 1,250 employees with a turnover of 500 million Euros. The Lundins unit manufactures plastic bags for the grocery stores market in Scandinavia.
To monitor their manufacturing process, Lundins tracks certain key performance indicators (KPIs) such as:
- LTAR-Lost Time Accident (index rating)
- Volume per Man Hour
- Energy consumption
- Delivery on Time
- OEE Manufacturing
- Stop Losses
- Scrap Quantity
Manufacturing KPI Dashboard Data Connection
The data is held within a DB2 database on an ISeries (IBM). They use our DataPoint software to connect to the database via ODBC and automatically update the PowerPoint KPI dashboard/slideshow with the KPIs. The KPIs are shown to their production team continuously on a 24/7 basis.
The highest interest KPIs are calculated on a 24 hour basis and are also summarized for the last 7 days.
The key reasons that they chose DataPoint for their KPI dashboard in their own words were:
- “It integrates with a well known and widely used software – PowerPoint”
- “It gives PowerPoint the functionality to dynamically extract/show data from different sources”
To find out more about how you can create your own KPI dashboard for any key performance indicator or to share how you use our software, please contact us.


