
In today’s fast-paced business environment, having access to real-time financial data is crucial for making informed decisions. Financial dashboards provide a visual representation of key business metrics, helping stakeholders monitor performance and identify trends quickly. This article will guide you through creating a financial dashboard in PowerPoint using the DataPoint add-on, a powerful tool that connects your presentations to live data sources.
Install DataPoint Add-on
Before you can start creating your financial dashboard, you’ll need to install the DataPoint add-on for PowerPoint if you haven’t already.
DataPoint is an add-on for PowerPoint that allows you to connect your presentation to 1,000s of different data sources, adding the capability for your slides to display real-time information.
Once you have installed DataPoint, you will see the DataPoint option in your top navigation ribbon in PowerPoint.

Set Up Your Data Source
To create a financial dashboard, you need a data source that contains your key business metrics. For this example, we’ll use an Excel file structured on common financial data such as an income statement, balance sheet and some other key financial data most companies have. You can also use the API from your favorite accounting program to directly access this data.

Design Your PowerPoint Financial Dashboard Layout
You can either start from scratch or export a premade template from sources like Canva. See our “Canva to PowerPoint to DataPoint Workflow” article for a step-by-step guide on how to do this. For the purpose of this article, and to make it look prettier 🦋 I am started with a Canva template that I exported to PowerPoint.
Add Placeholders for Key Metrics
If you are starting from scratch, you insert charts, tables, and text boxes where you will display your financial metrics using the regular PowerPoint insert menu. If you are working with a template, you can also just link the existing charts, tables, and text boxes to the data in your Excel spreadsheet.
Connecting DataPoint to Your Excel File
See the image below for a visual walk through of the connection steps
- In PowerPoint, go to the DataPoint tab
- Under the Connections Category, click on ‘List’
- Choose ‘Excel’ as your data source
- Click on ‘Add Connection’
- Browse to your Excel file.
- Click on ‘Ok’ to save your connection

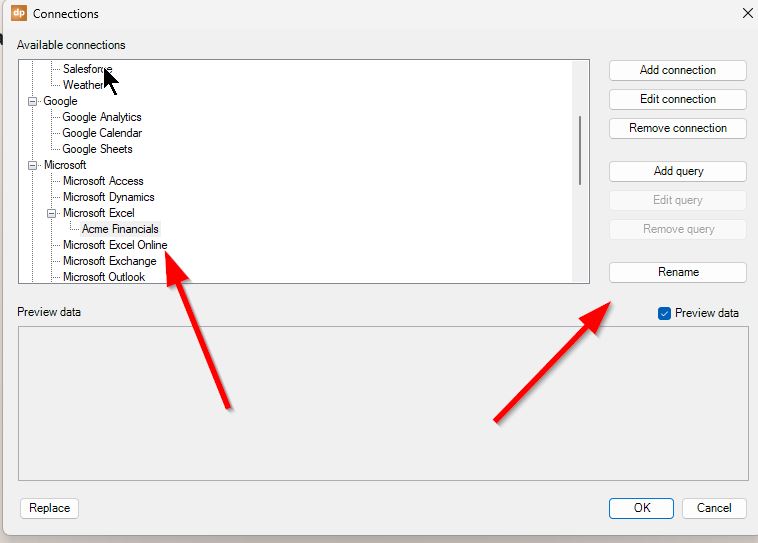
Rename Connection
As a best practice, we highly recommend you rename all your connections and queries as it can be difficult to tell which connection is which is you have multiple data sources labeled ‘New Microsoft Excel connection’. The image below shows you where to find the ‘Rename’ button. This this case, we renamed it to ‘Acme Financials’.
Add Your First Query
Now we add your query to choose which data on the spreadsheet:
- Click on ‘Add query’
- When the window for the Excel worksheet comes up, choose which worksheet you want the data from for the first set. In this case, I will start with ‘Balance Sheet’.
- If the first row contains names, tick this box so you don’t show the labels.
- Choose how often you want the presentation to refresh. For most financial statement uses, ‘Only once at opening of the presentation’ is sufficient, but if you want a live dashboard showing KPI, you could refresh it every hour or every 60 seconds.

Create Profit and Loss Query
Now that your layout is ready, it’s time to link your data source to the dashboard elements.
In this case, I have a slide “At A Glance” where I am going to show Total Revenue, Expenses, and Profit each in a separate text box.
- Go to the ‘DataPoint’ option on the PowerPoint navigation ribbon
- Click on the ‘List’ command under ‘Connections’ and go to the existing connection under Microsoft Excel of ‘Acme Financials’
- Click on ‘Add Query.’
- Go to the ‘New Query
- Scroll down to the ‘Profit and Loss’ worksheet
- Click OK, then OK again to save the query

Now you can see your preview data to ensure it is the correct connection and worksheeet. Once again, rename the query so you can find it later – in this case ‘Profit and Loss.’

Connect Text Box to Data
Now we are going to connect the text box to data
- Go to the DataPoint tab
- Select the relevant type that matches (text box, chart, or table) – text box in this case
- Click on the first text box you want to connect to data
- Choose the data connection
- Choose the column and row on the spreadsheet that connects to the right data
- Check to see you have the right data in the ‘Preview’ area
- Click on ‘Ok’

Rounding and Formatting Your Data
When we click on ‘Ok’, this creates a problem. The original number was 35K and now our number shows 4000000. It is totally the correct number but for this template, we would want to format it so it would round the number and show as 4M.
Here is how we format the number.
- Click on DataPoint
- Click on the text box we want to format
- Click on the ‘Text box’ menu in the DataPoint
- Click on the ‘Format’ tab, then choose ‘Custom’
- Insert this code \N\0,,
This code will change the format to remove the zeros relating to millions. This coding can be found in our documentation here.

Suffixes
Now we have to add the suffix “M” for millions. You do this by clicking on the ‘Texts’ tab and adding M into the suffix area, then hit ok.

Repeat for Additional Data
Now we repeat these steps for Expenses and Profit on the slide.

Gross Profit Margin
Now, let’s move to another slide and calculate our Gross Profit Margin.
Gross profit margin is a financial metric used to assess a company’s financial health by revealing the proportion of money left over from revenues after accounting for the cost of goods sold (COGS). It is expressed as a percentage and indicates how efficiently a company uses its resources to produce and sell products. A higher gross profit margin means that a company retains more capital from each dollar of sales, which can be used to cover other expenses and generate profit.
How Gross Profit Margin is Calculated
The formula for calculating the gross profit margin is:
Gross Profit Margin = (Total Revenue−Cost of Goods Sold)/Total Revenue) ×100
Where:
- Total Revenue is the total income generated from the sale of goods or services.
- Cost of Goods Sold (COGS) is the direct costs attributable to the production of the goods sold by a company. This includes the cost of materials and labor directly used to create the product.
In this case, I have already created the formula in the spreadsheet on the Gross Profit Margin worksheet tab, so all I have to do is connect a single text box to the resulting cell in the Excel spreadsheet.
I copied the last slide and changed the title to show Financial Ratios and adjusted the color so I didn’t get confused what slide I was working on.
So I go to the DataPoint menu in PowerPoint, and click on ‘List’ then ‘Add Query’ to the existing Acme connection. Then I rename the connection.

Now that we have the Gross Margin worksheet query, I find the row and choose the calculation I need. I also clicked on ‘Format’ and chose ‘Percentage” so it will show the number as 70%.
The next step would be to repeat this process for other ratios such as Net Profit Margin, Acid Test, and Return on Equity.

Live Financial Dashboard is Ready
Once we finish all the connections, our financial dashboard is live! Every time you open the presentation or the presentation refreshes depending on the refresh rate you set, your financial dashboard will always show the newest data and ratio calculations.
Want to create your own financial dashboard. Download our free trial of DataPoint today! Reach out if you have any questions.
Get Started with DataPoint Today!
Download your free trial

