Possibilities 01: Static PowerPoint vs. Dynamic PowerPoint
Many people seem to consider PowerPoint to be a tool to provide and display static info. Now, what do I mean by static info? Static info is something you feed in, and it never changes unless you go and make changes manually. When I say static info, the info could be...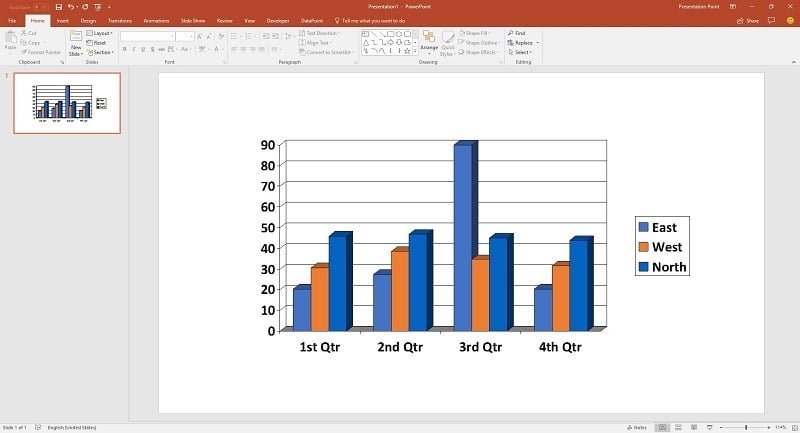
Dynamic Charts and Graphs in PowerPoint
Charts are great to visualize data. Look at a simple bar chart. It visualizes information and immediately plots the information on an X and Y axis. Products compared to countries, teams compared to productivity, and so on. Or a pie chart. See what part of the pie is...