
The logistical companies are one of those, which use a bunch of digital data about tracks, cargoes, sorting and loading areas, offices buildings and many more. They require processing the information in real time in order to coordinate the working process and make it more effective.
DataPoint is designed to help various companies including logistical ones. What is DataPoint? What are its features and benefits? How can it help the logistical industry? Let us look closer.
- Social networks: Facebook and Twitter
- A bunch of Microsoft Office files including Excel, Outlook, SharePoint, etc.
- Internet data files such as Google Sheets or Calendar, JSON, RSS, Yahoo Weather, etc.
- Most popular databases like Oracle, MySQL, or any other.
- CSV and text data files.
DataPoint with external data sources will provide the logistical company:
- Up-to-date, real-time presentations (you do not have to manually refresh the data as it opens and refreshes automatically)
- Real-time information on the slideshow on your screen (you can even see how your trucks move right on the real-time map)
- Generate product catalogs (adding real-time data to your presentation)
Automated reports. While you use databases for Microsoft Excel to process the working information, you use PowerPoint to present the reports. With DataPoint, you can combine PowerPoint and Excel strong points and provide regular reports. The information will be regularly updated and the generation process fully automated.
Real-time points. Connect your presentation to an external data source to show the data on the screen in real time.
Notice boards. Display the notice boards on a large TV screen and share the real-time presentations with instructions, announcement, news, etc.
External data sources. Connect your PowerPoint presentation to social networks, weather services, Google Calendar, a variety of databases, RSS feed, XML file, and many more.
Link additional resources. Show real-time data from a table, chart, text box, gauge, etc. Real-time updates. Are you tired of manual updating the data in the presentation? With DataPoint, you will get the data in real time.
Scroll data. When the information does not fit one slide, use data scrolling and show all data on one physical slide.
Rules and conditions. Setup and manage rules to accent the information you present.
Graphical information system. In addition, with our software, logistic companies can turn PowerPoint presentations or any visual information in general into a graphical information system (GIS) to display resources on any map in real time. The GIS is a presentation that displays they mean objects on the map in real time. Imagine that you can see the position of your trucks right at the moment. For that, you will not have to call the driver and ask where he is. DataPoint allows creating your own system based on a PowerPoint presentation. How does it work? Let us suppose that one pointer is the truck. If you, for example, want to track 5 trucks, add 5 pointers. The data source will send the track position and the DataPoint will display it on the map in real time. To connect the map to the database, the technician has to make three simple steps:
- Add a map to the presentation. It can be the map of any territory that you require: city, country, factory, or even loading zone.
- Add the necessary amount of pointers.
- Connect your PowerPoint presentation to the data source with DataPoint.
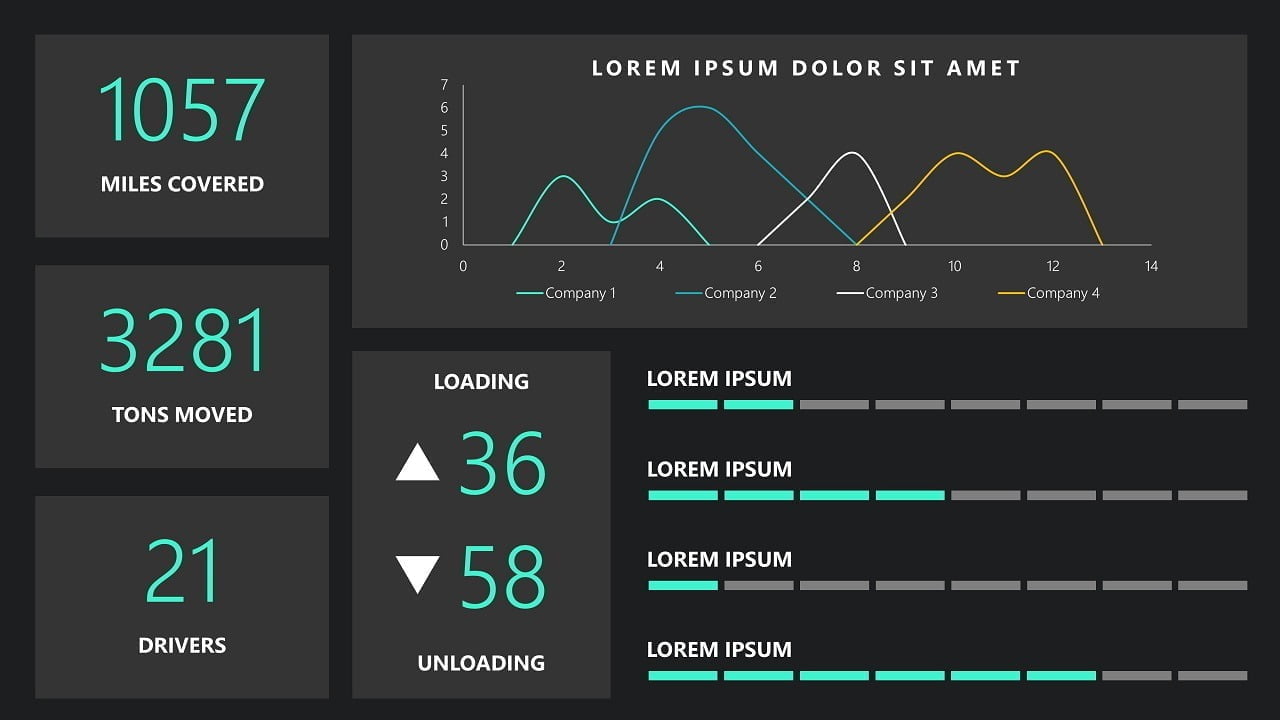
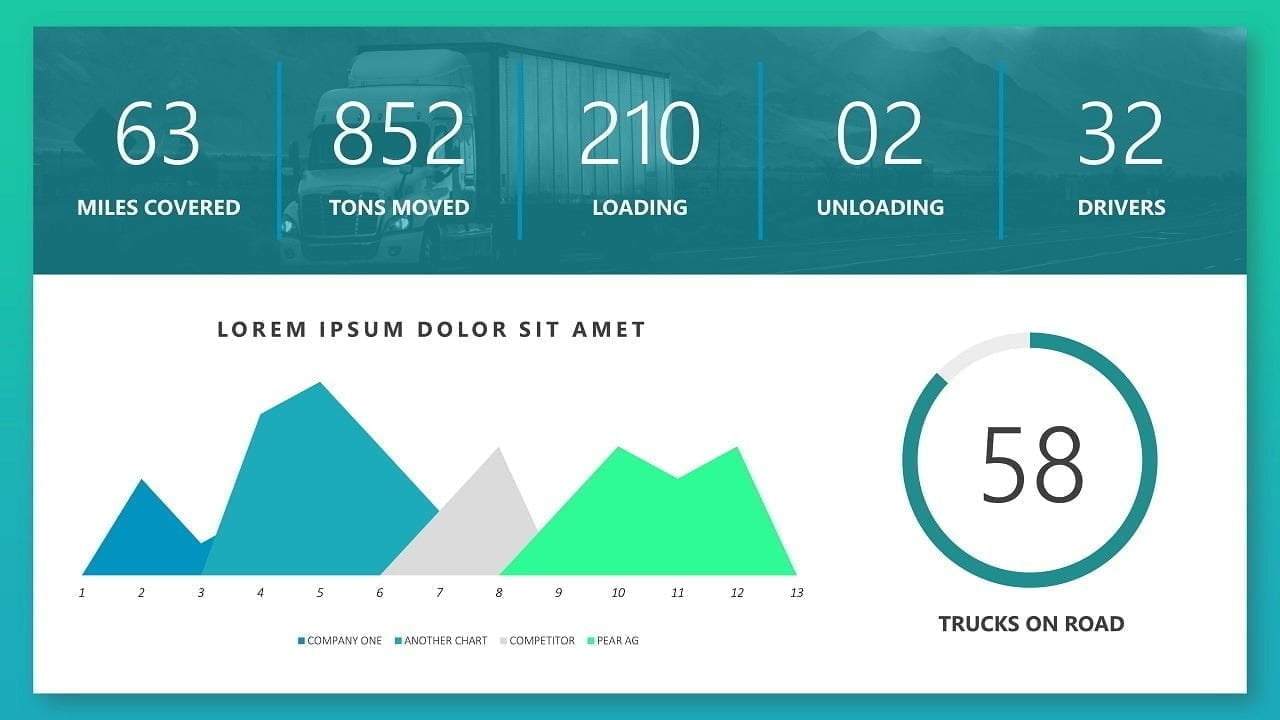
The logistical sector may require data-driven presentations/logistics dashboards in the following situations:
- Timely instructions. For example, your manager sees the truck on the map and can send immediate instructions to load it for the customer.
- Fast messaging. You will be able to contact any truck driver and provide the necessary information.
- Setup and display deadlines. You will accept the full details about the order, such as the deadline, destination, etc.
- Traffic information to plan the route without traffic jams.
- Weather information will help to avoid the natural disasters and delays.