
Recently one of our customers who wishes to remain anonymous sent us a screenshot of how they set up an equipment monitoring system dashboard system using our software.
There is a lot to unpack on this one single screen that shows a lot more than you think. Let’s have a look at what they have done.
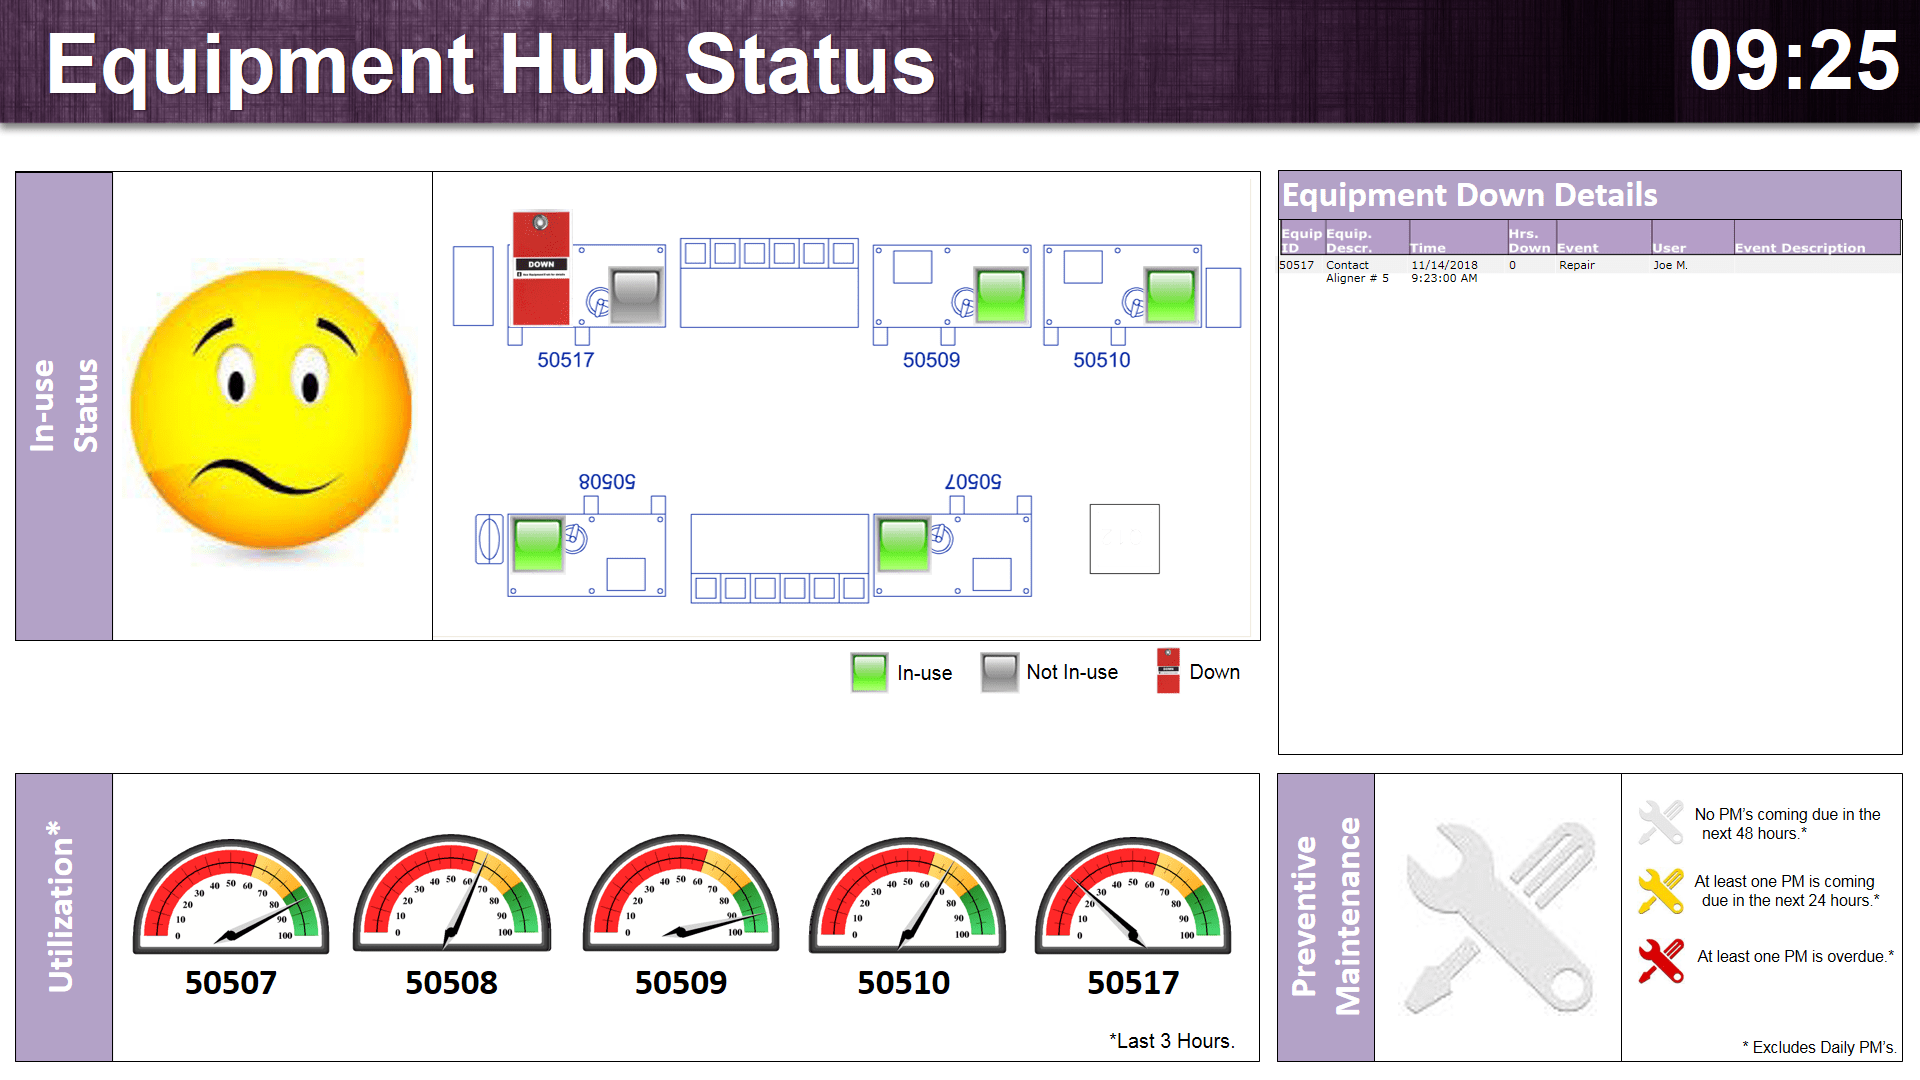
- Header: The header is really simple. It merely shows the time and the title of the dashboard, “Equipment Hub Status.” Showing the title of the dashboard is a good practice to get into because you might have a monitor rotate through multiple equipment system dashboards. A header showing the dashboard name makes it easy to know which one you are looking at.
- In-Use Status: The in-use status section (mid left) Consists of a smiley face emoticon, then a map of the facility along with where each piece of equipment is located along with an indicator of the current status – green for in-use, grey for not-in-use and red for down. This information is taken directly from the equipment in real time and shown on the dashboard. So you can see at a glance when a piece of equipment is not in use or down and where the problem equipment is located. In this screenshot, equipment 50517 is currently down (red) and the rest are in-use and working (green). These graphics and colors change automatically from green to grey to red and back based on the output from the equipment. The smiley face emoticon can also change. It can be a full smile for when the equipment is all up, partially concerned when a piece is down or frowning when multiple pieces of equipment are down.
- Utilization: The utilization dashboard (needle-type gauge on the bottom left) go beyond binary information like in-use or down and provide actual numerical data on the gauges of the utilization levels over the last 3 hours. In addition to the number on the dial, the red/orange/green ranges give you a quick feel for where equipment is underutilized. Once again, this information is in real time, taken from the equipment and will update automatically.
- Equipment Down Details: Equipment down details shows the equipment ID, description, time it went down, elapsed time it is down, repair status, user, and the reason the equipment is down. This way you can quickly ensure any offline equipment is being worked on. This information would be taken from wherever you keep your equipment maintenance logs and would update automatically.
- Preventative Maintenance: This shows a list of your upcoming preventative maintenance. This information would be taken from your maintenance schedule and would update automatically.
This equipment monitoring system dashboard was created using a simple design tool, PowerPoint along with our PowerPoint add-in, DataPoint. DataPoint automatically gathers the information from the equipment reporting outputs, maintenance logs, and schedules and updates the dashboard as often as you like.
Want to try DataPoint for creating your own equipment monitoring system dashboard? You can access our DataPoint free trial here. Have questions about how to set up your own dashboard? Contact us.


Hello- Can you tell me which software they were using.
Thanks,
Duane
Sure. That is our DataPoint Standard edition, as plugin for real-time data in PowerPoint.
https://presentationpoint.com/software/datapoint/