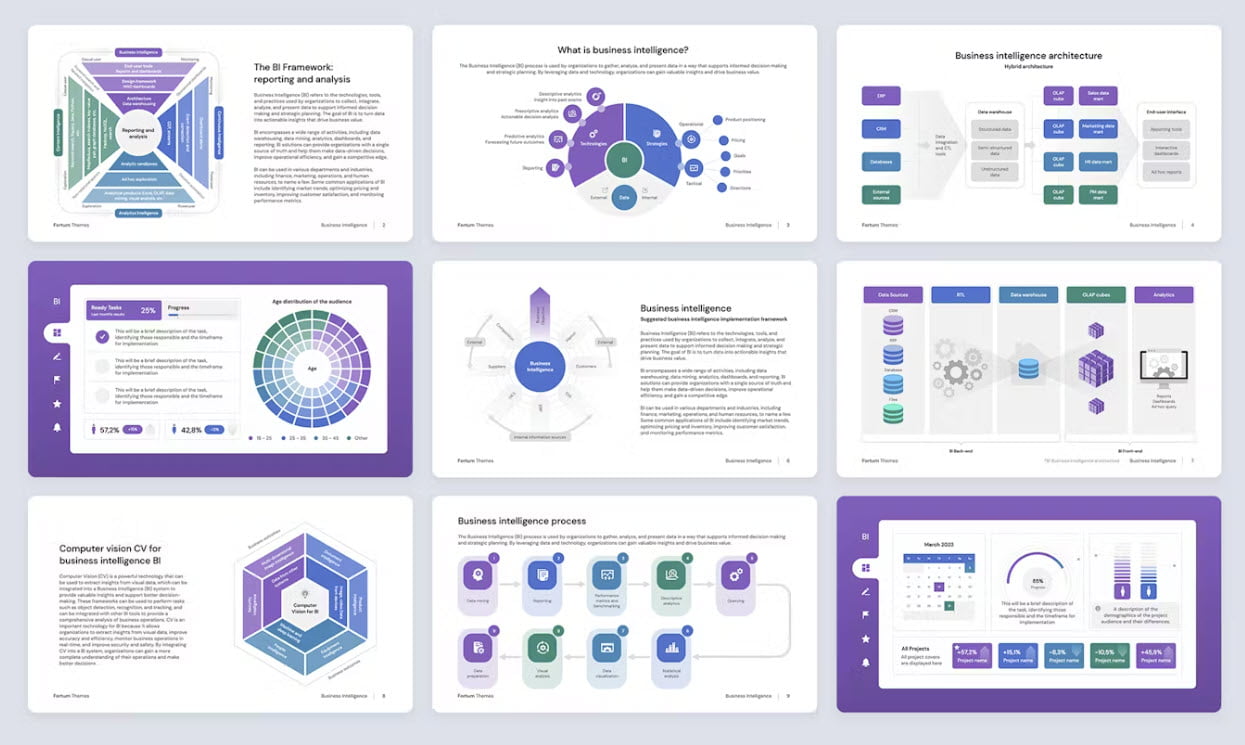
Choosing the right tool for data presentation and analysis is crucial in a business environment. While Business Intelligence (BI) tools like Power BI offer comprehensive data analysis and visualization capabilities, there are compelling reasons to consider PowerPoint coupled with the DataPoint plugin for specific scenarios. Here’s why:
1. Familiarity and Accessibility
PowerPoint is a well-known and widely used tool in most professional settings, making it accessible to a broad audience. When combined with DataPoint, it leverages this familiarity, allowing users to create dynamic, data-driven presentations without the steep learning curve associated with new software. This can be particularly advantageous for environments where quick turnaround and widespread user proficiency are valued.
2. Integration with Existing Workflows
Many businesses already have workflows and processes built around PowerPoint for reporting and presentation purposes. Integrating DataPoint allows these existing workflows to be enhanced rather than replaced, ensuring continuity and reducing the need for extensive retraining or adjustment periods.
3. Real-time Data Updates in Presentations
While BI tools excel in data analysis and reporting, presenting that data in real-time within a live presentation environment can be more cumbersome. DataPoint allows users to link live data sources directly to PowerPoint slides, ensuring that the information presented is always current, without needing to switch between different applications during a presentation.
4. Customization and Brand Alignment
PowerPoint’s extensive customization options allow for presentations that are not only informative but also closely aligned with the organization’s branding and visual identity. DataPoint enhances this by enabling real-time data visualizations that maintain brand consistency, something that can be more challenging to achieve in standard BI tools.
5. Ease of Sharing and Compatibility
PowerPoint presentations, enhanced with real-time data via DataPoint, are easily shared and do not require the recipient to have any special software beyond PowerPoint itself to view updated data. This contrasts with BI tools, which may require specific viewer licenses or access permissions, potentially complicating the sharing process.
6. Focused Narratives
PowerPoint allows for a structured narrative flow, guiding the audience through a story or argument in a controlled manner. When enhanced with DataPoint, it ensures that this narrative is supported by the latest data, providing a compelling and persuasive tool for decision-making presentations where the flow of information is as critical as the data itself.
7. Cost-effective for Smaller Scale Requirements
For organizations or projects where the full spectrum of BI tools features goes unused, PowerPoint with DataPoint can offer a more cost-effective solution. It provides the necessary level of data integration and presentation without the potentially higher costs associated with comprehensive BI software suites.
Summary
While BI tools like Power BI are invaluable for deep data analysis, the combination of PowerPoint and DataPoint brings unique advantages. It offers a familiar, accessible, and integrated solution for dynamic and persuasive presentations, aligning closely with business needs for real-time data display, narrative control, and cost-efficiency. For situations where the story behind the data is as vital as the data itself, PowerPoint and DataPoint stand out as an excellent choice.

Show Real-Time Data with DataPoint Today!
Download your free trial


