You can use our DataPoint add-on for PowerPoint, which adds extra functionality to PowerPoint tables. DataPoint enables you to connect to any data source and display this information in real-time on your slides. Of course, next to the connection info, you need PowerPoint shapes like text boxes and tables, to host and display this information on your slides.
1. Insert normal PowerPoint tables
First of all, we will start with a normal table shape in PowerPoint. Start with a new presentation, select a slide and click the Insert option from the normal PowerPoint ribbon. Click to insert a Table. Choose e.g. a new table with 4 columns and 10 rows.
2. Setting up a data connection
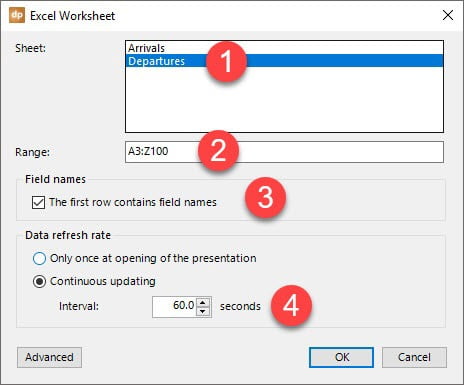
For this article, we will use real-time information from a simple Microsoft Excel spreadsheet to insert in PowerPoint tables. With DataPoint, you can link to other data providers like databases and more, but Excel is easy to use and understandable for everyone.
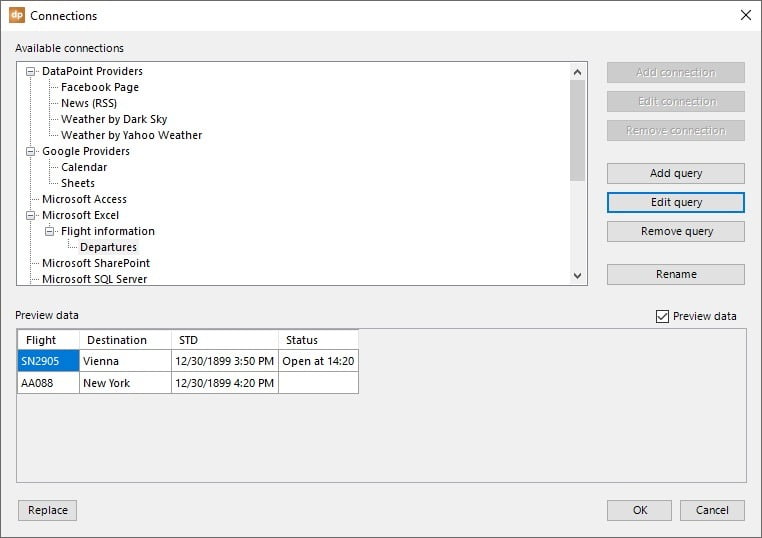
Click to open the DataPoint ribbon and click the List button of the Connections group.
Click OK to close and you will see a preview of the data. You can here again, rename the name of the query.
3. Use data in PowerPoint tables
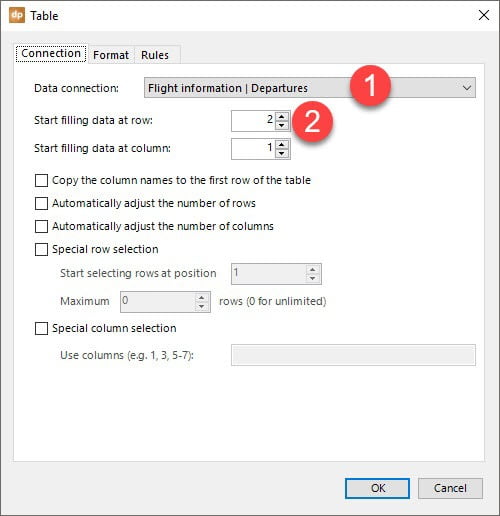
Now, we have established a connection to the data source and we have this data available for usage on our slides. Select the table that you want, to show the dynamic information and click DataPoint to open the ribbon with DataPoint options. Secondly, click the Table button.
Note: Departures flight information is in the sample.
Set the Start filling data at row to 2, because we want to set our own header texts at the first row of the table.
Click OK to link the table to the data.
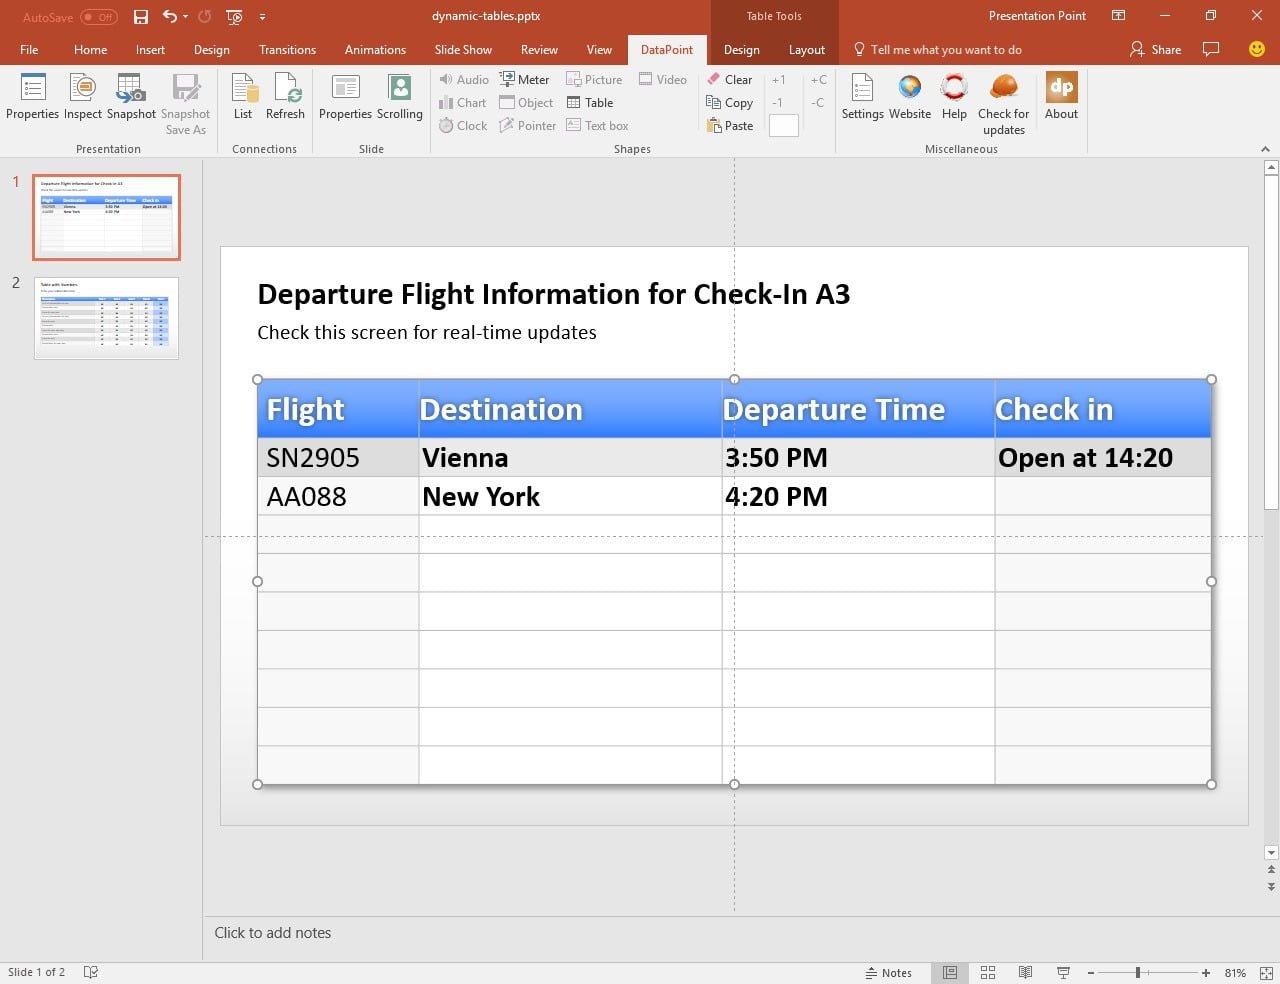
We can reopen the presentation, and its linked data will be updated in the opening time. We can also run the slide show and DataPoint will continuously update the information on the slide, without stopping the running slide show. You can open the data source (Excel file here) at any other computer in your network, update the data and save the file. The new information will be visible on your slide show within seconds.
4. Run the slide show with real-time updates
This is how our self-updating table will look like in slide show mode. You can use a small computer and a computer screen or television screen to show it at large in your office or building.






Hi. Can a linked XL table cell data item ‘set the attributes’ of a symbol on PPT slide; eg cell data = ‘1’ makes (via code/macro?) the slide box colored red and cell data = ‘2’ means slide box is blue (after refresh). Thanks. Mike
Hi Mike, have a look at our datapoint product that you can use to connect and display real-time data. In there, you can use rules and conditions to change this. https://presentationpoint.com/blog/data-rules-or-conditional-formatting/
Or even great visuals that you can use like this: https://presentationpoint.com/blog/traffic-lights-as-dynamic-semaphores/