 Something completely different in this article. Humans like soccer and they follow their favorite club(s) and the rankings. Now you can display live soccer information like ranking and scores in real time in a data driven PowerPoint presentation. Some people run a kiosk system or display system to advertise their products and services. They add local news and sports information to get more attention. Many of those presentations are created as Microsoft PowerPoint presentation. Now there are a few ways to update this hot sports information in your presentation. You can stop the running slide show, go to your page and edit the score and start the slide show again. But this is visible to the public via your screens. So this method is not really an option. There is a tool called DataPoint on the presentation market that allows you to set up a link to a data source and then DataPoint displays the information in real time on your screen without interrupting the slide show. You can manually feed your sports database but there is a better and automatic way that I want to show you. There are data providers out there that provide real time sports information and scores via XML data feeds. We tried out Xscores.com and tried to link their XML sport feeds to our presentations.
 Get external data
Xscores.com is a company that features real time results for tennis, basketball, hockey, baseball and American football games. You can learn everything about the number of live games that are currently playing and when the next game starts. Xscores.com provides the fastest updates, livescores, keeps track of history results, offers detailed and updated information for all games, gives you the ability to have a personalized experience according to your preferences and interests and is the optimum way to stay updated! When you sign up with them you get your username and password to log in to your account and some documentation on how you read the data from their service. There are 2 types of calls; update calls for live data and structure calls to list countries, competitions, teams etc. If you want to retrieve the soccer matches of this week, you use the following URL: http://data2.xscores.com/exporter/?state=clientUpdate&usr=[username]&pwd=[password]&type=4&s=1. S 1 stands for soccer and type 4 stands for this week’s matches. When you execute this you get this returned by the live sports feed;

Set up connection
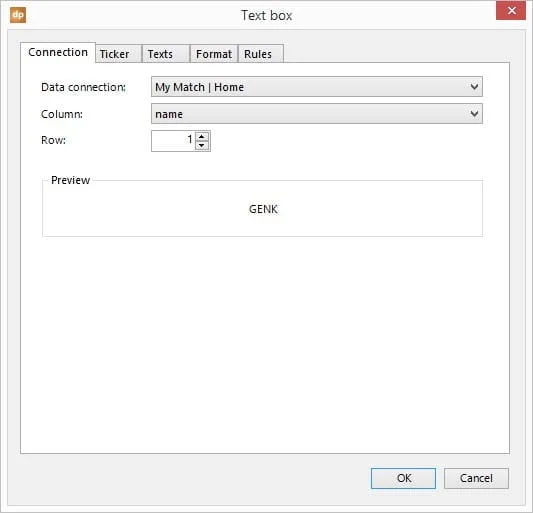
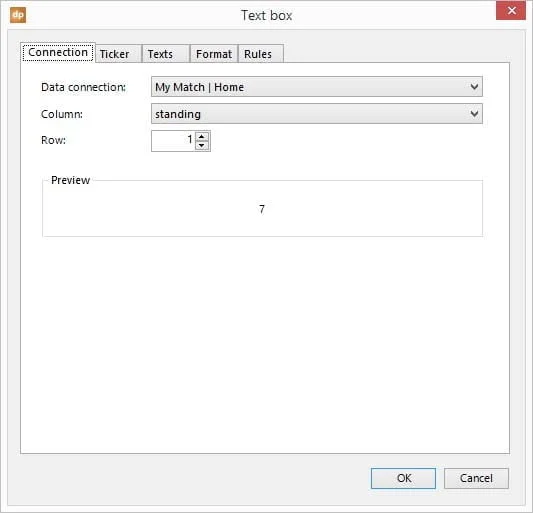
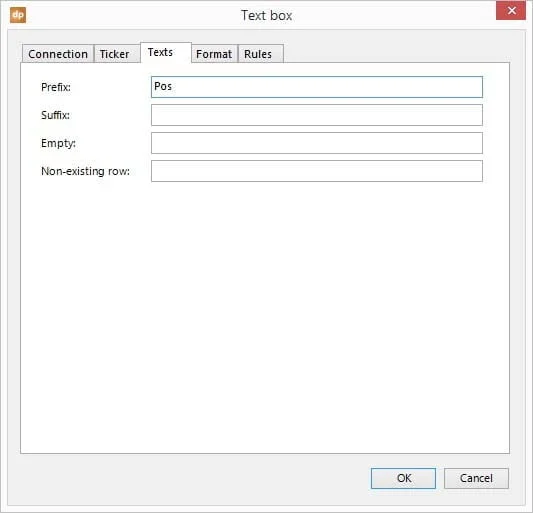
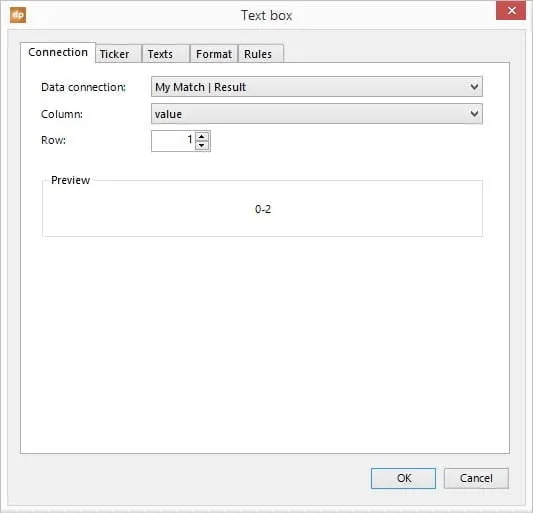
With DataPoint you can use that XML data stream and display a real time score board for a given game, or an overview of the ranking. Let me show you how you can display the score of a given match in PowerPoint with real time data. First make sure that DataPoint is installed on your computer with Microsoft PowerPoint. Click DataPoint in the PowerPoint menu.


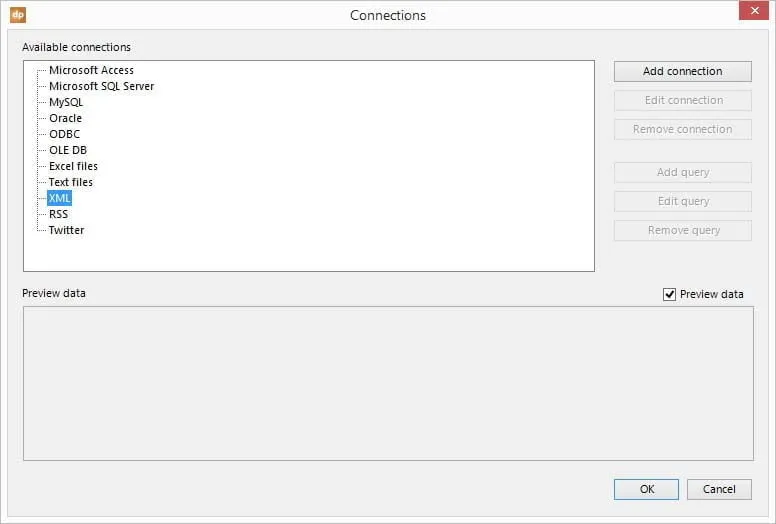

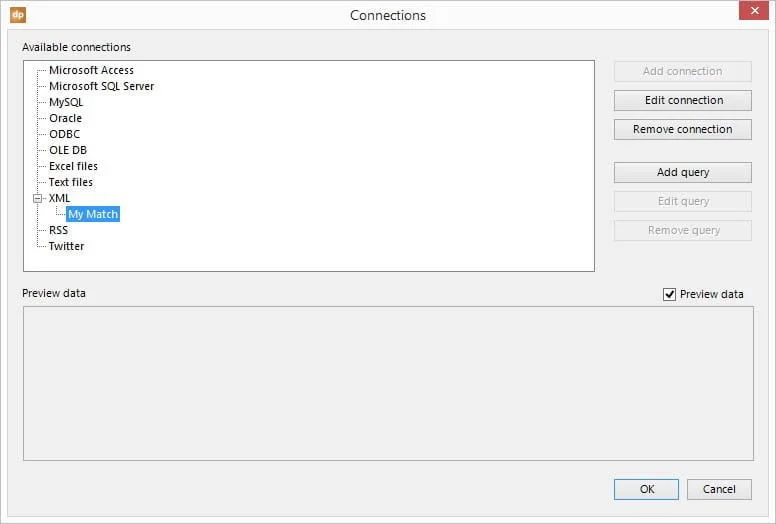
Add queries to xml data tables
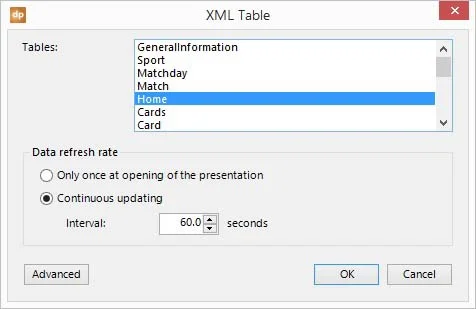
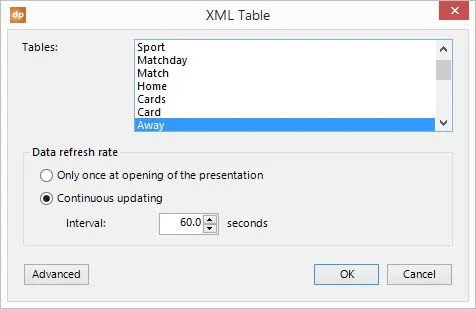
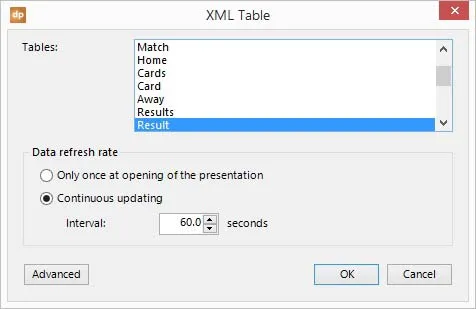
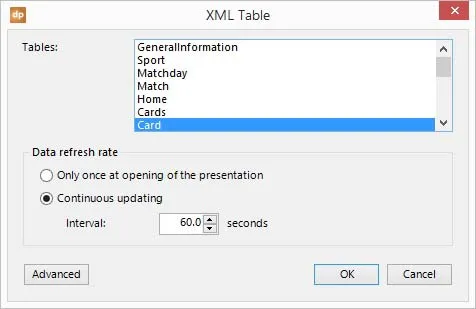
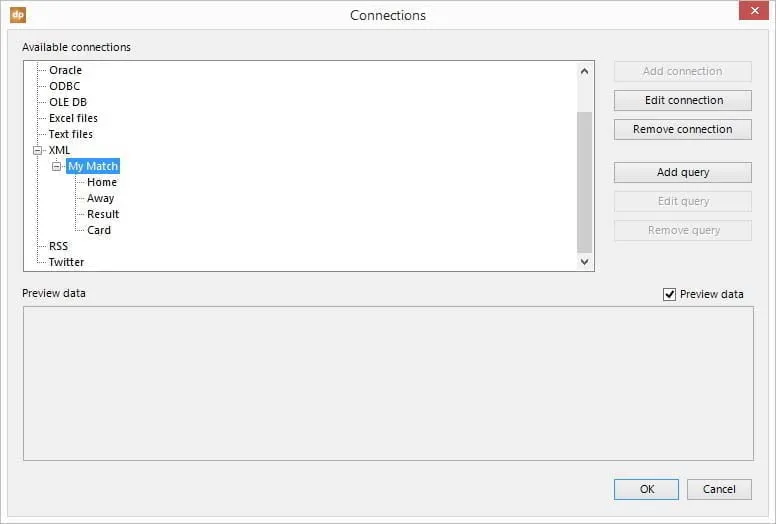
Now click the Add query button and select the Home table and click OK to close.

Prepare for continuous slide show
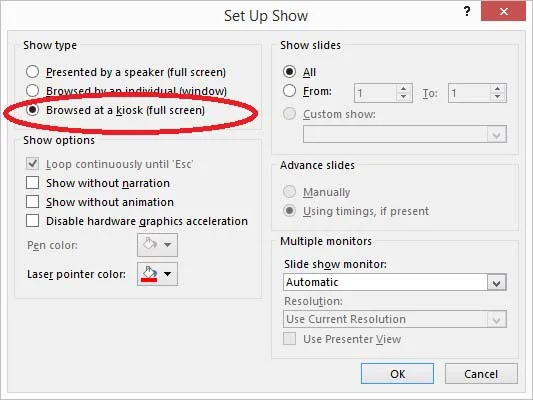
Now, as a final action we want to make sure that the slide show will run continuously. Click Set Up Slide Show in the Slide Show menu and set the Show Type to Browsed at a kiosk and click OK to apply.
