Every week we get the question on how you can prevent all columns of your dataset that are copied one by one in the table on your PowerPoint slide. People use DataPoint to link to data of any format and then display this information in real-time in PowerPoint tables.
Typically we have 2 options;
- In the table, set the width of the unwanted columns to 0.
- Remove the columns already at your data connection or SQL.
This second option is not possible for e.g. RSS feeds, XML files etc where you have no control over the columns included in the dataset. So we had to come up with something better.

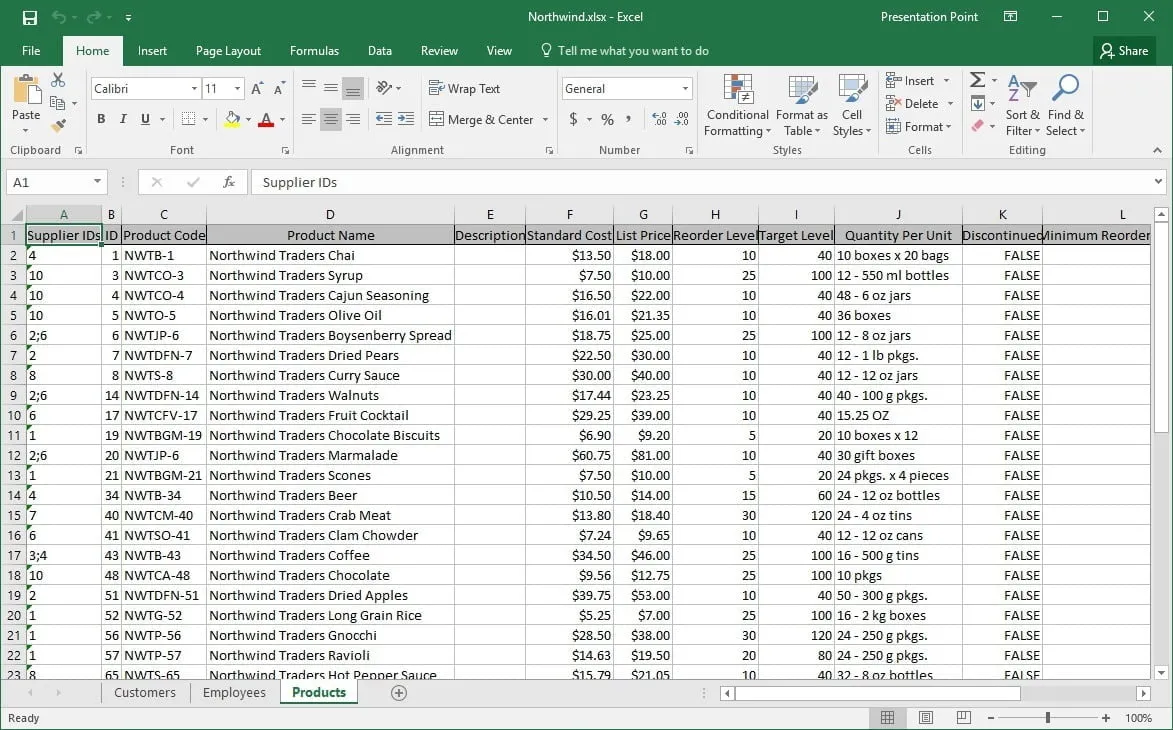
In the above screenshot, you will clearly see that the 2 first columns that holds numeric information, some internal database IDs that are not worth publishing, since they have no real meaning on a PowerPoint slide. So that is what we want to hide.
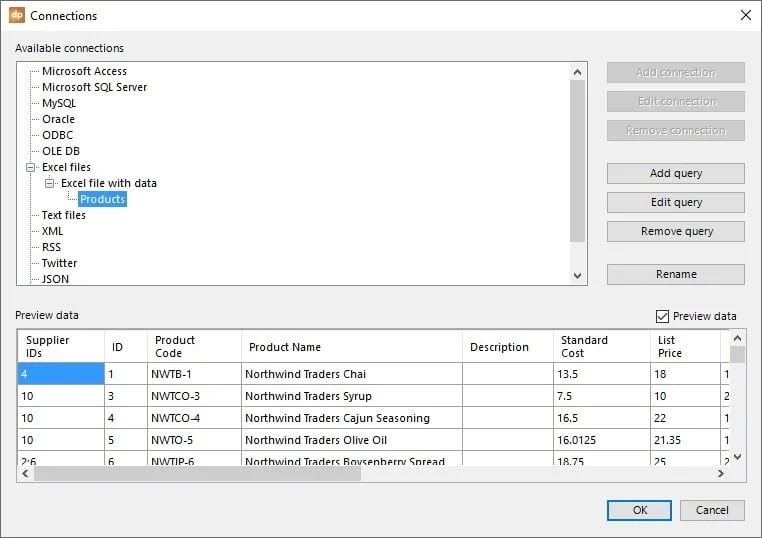
Within DataPoint, we start to set up a connection to the Excel file, our data sheet, and the import range that we define. Read more about Excel linking in PowerPoint.

Add a table to your slide.

Click DataPoint, then the Table button.

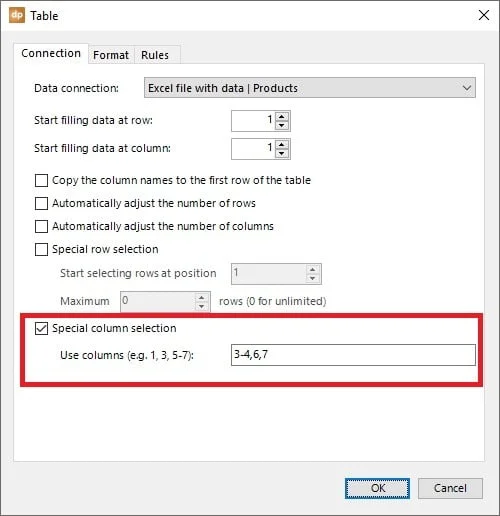
Select the data connection in the top and enable the option called Special column selection.
In the Use columns field, we can list the column numbers that we want to include in the table data. This works the same as when you print some selected pages of a text document.
You can easily add the column numbers to the list here, separated by commas like: 2, 5, 7
Or you can set a range of columns like: 2-5 which means that you want to include the column numbers 2, 3, 4 and 5.
Finally, you can make a mix of the 2 different notations where you use e.g. 3-5, 7, 8 when you want to include columns 3, 4, 5, 7 and 8.

Click OK to confirm.

This new column selection for dynamic PowerPoint tables, is available as of now in our DataPoint. Update your DataPoint installation to get this feature for free.


