Learn how to use DataPoint technology to show live XML data on your slides. You will see how to connect your textboxes, tables and charts to XML data on your computer, or XML data residing on the internet. When you open your PowerPoint presentation, the content of your textboxes, tables and charts is updated automatically. You can generate a snapshot presentation out of it, or display this information in real-time on a computer screen.
XML data is typically data originating from a database, but made available to the public, without granting permission on your database. So you export your table or query information of your SQL database, to an uniform and flat data file. You can put this XML data file on a network share, your local drive, or on a webserver.
In this article here, we will use the USD/EUR exchange rates as they are made available by Yahoo. This is just an example and you can use any other XML data file for your purpose. Yahoo offers the USD/EUR exchanges rates and other currency exchange information on the site.
The URL of this is:
https://query.yahooapis.com/v1/public/yql?q=select%20*%20from%20yahoo.finance.xchange%20where%20pair%20in%20(%22USDEUR%22)&env=store%3A%2F%2Fdatatables.org%2Falltableswithkeys
and shows the following information in a browser;
So from this complex readable file, you can find out that a US Dollar is worth 0.92 EUR, at this time. Yahoo will keep this information up-to-date and update this information continuously. Imagine that we need to display this exchange rate in our presentations, or display it on a television screen for information to our colleagues at the bank.
After the installation of DataPoint, we see a new DataPoint item in the PowerPoint ribbon.

Click the DataPoint menu option. For the List of the Connections group, click here.

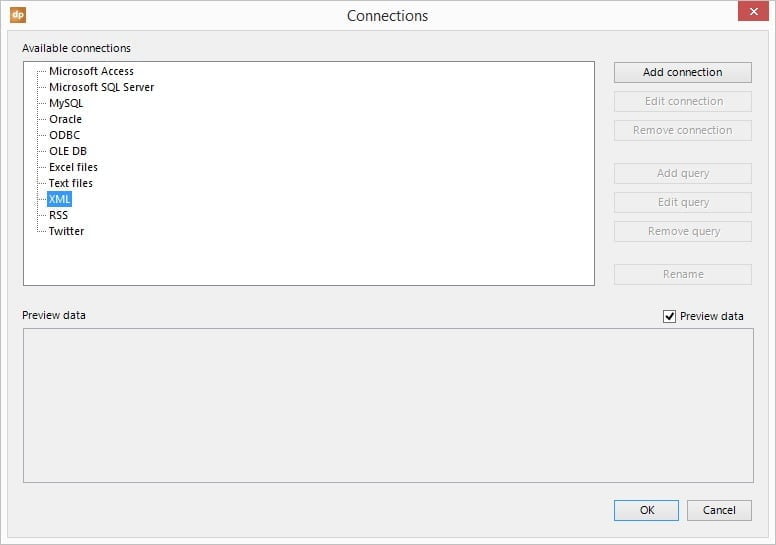
Select the XML node in the tree and click the Add connection button.
Enter the URL of the remote XML data file here.
https://query.yahooapis.com/v1/public/yql?q=select%20*%20from%20yahoo.finance.xchange%20where%20pair%20in%20(%22USDEUR%22)&env=store%3A%2F%2Fdatatables.org%2Falltableswithkeys
Calling this URL returns an XML formatted file or document that DataPoint can read. Hit OK to close.

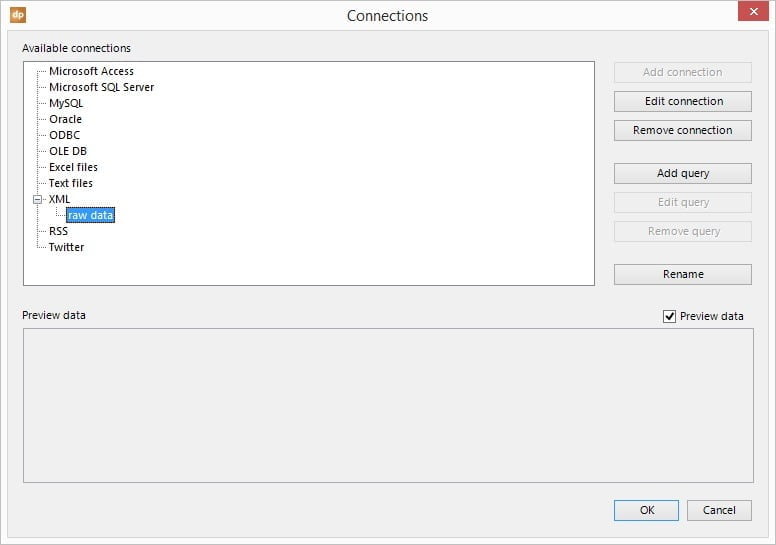
Rename the connection and hit the Add query button.
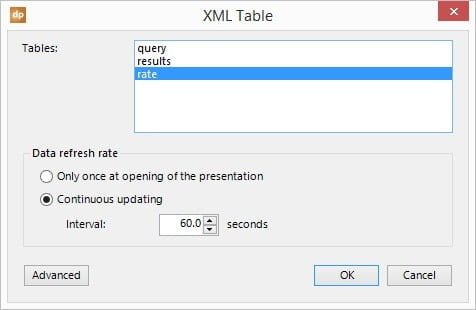
You get an overview of the data tables that are present in the XML file. For this purpose, select the rate table. When needed, you can change the updating interval for more often or fewer updates. Default here is 60 seconds. Hit OK to close.
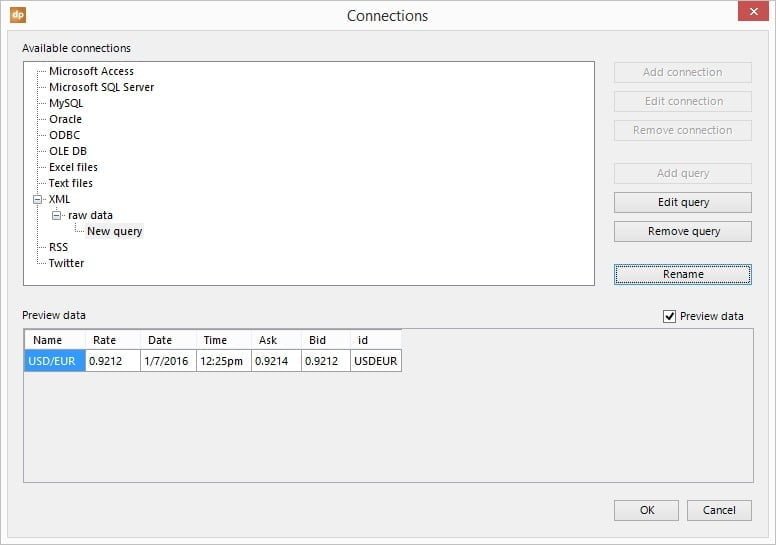
Now we have set up a live connection to the XML data file and see a preview of the data here already at the preview pane. Hit OK to close again.

Add a background image to your slide and select a first textbox of your slide. Click DataPoint in the menu, followed by the Textbox button.

Select Name from the list of fields and click OK.
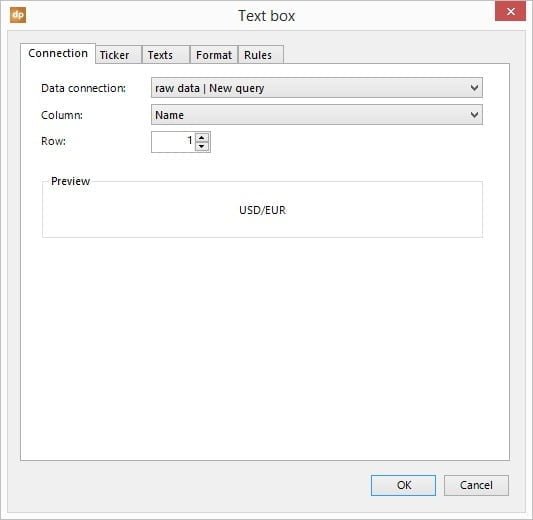
The value of the Name column is now copied into the textbox.

Repeat the same action for the rate column. Add or select a second textbox and click the Textbox button of the DataPoint menu. And select the column Rate from the columns list. Hit OK.
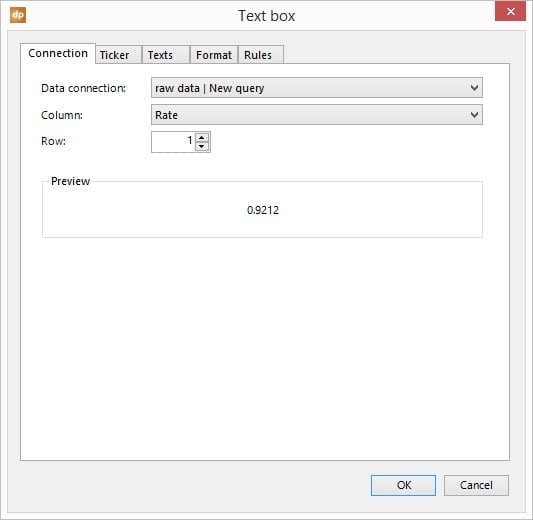
Perfect. The 2 textboxes are now linked dynamically to the fields of the remote XML data file.

Finalize the layout of your slide and we are ready. Next time you open your presentation, the name and rate will be updated automatically with the latest values. And you can run the slideshow, repeating this and other slides, and the information will be updated every 60 seconds as we have set it to be.


I need to consume XML in Powerpoint
Hi Tienie, that is possible with our DataPoint plugin. Free trial available. Let me know if you have further questions.