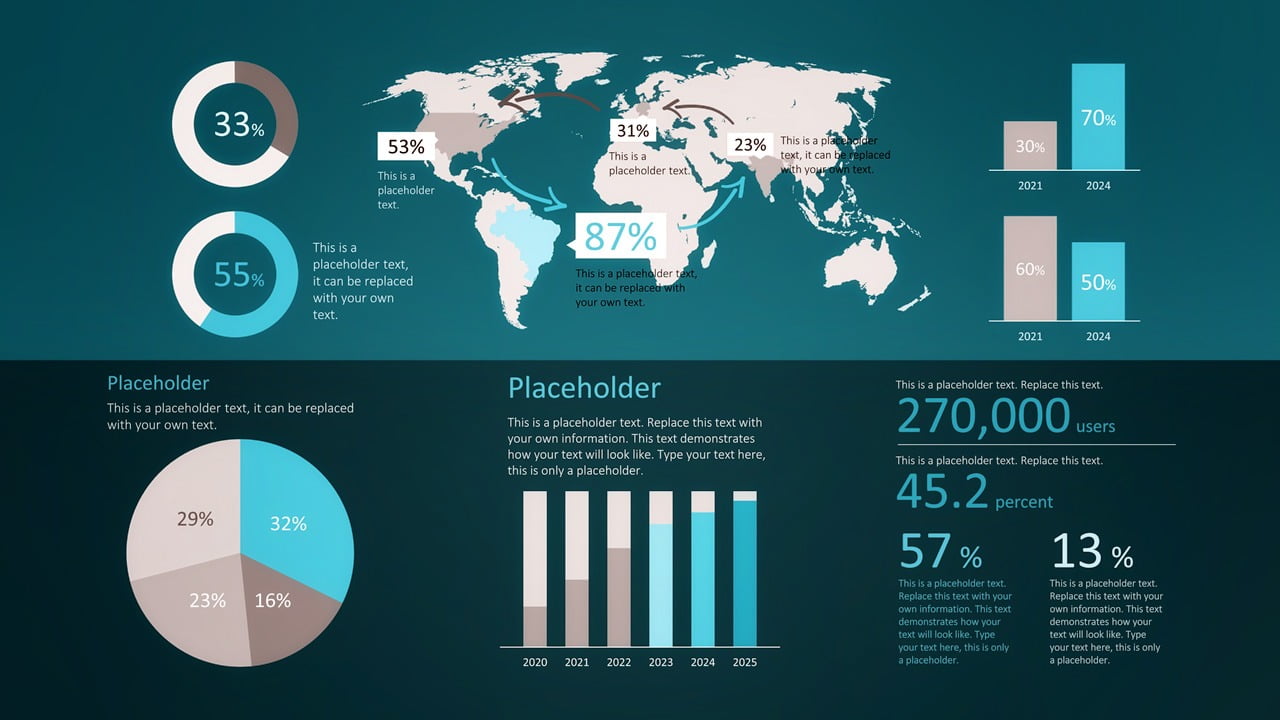
PowerPoint makes it easy to build your own dashboard software with its simple and familiar interface. The accessibility of the program makes it easy for your audience to find the essential information about the topic that you are covering. Effective dashboards will have at least two elements and buttons that will lead the viewer to new slides or areas of the program. PowerPoint can be connected with other Microsoft Office programs, so you can easily import information with a few clicks of a button. Here is how you can create dashboard software using PowerPoint.
1. Start a New Presentation
The first step to create dashboard software using PowerPoint is to open a new Presentation in PowerPoint. Once a new presentation is open, you will need to delete all the text boxes that are on the first slide. This is simple to do because you just need to select the text box and press the Delete key on your keyboard. You can also click on the little x or garbage can icon when the text box is selected to delete the text box.
2. Add Images
You start creating your Dashboard software by clicking on the Insert tab, then the SmartArt button. This will open a gallery of templates, flowcharts, timelines and shapes that you can use to summarise your data or make it more interesting for your viewers. There are many options that you can pick from. To add one to your slide, you will need to select it by clicking on it, and then click ‘Ok’.
You can also add your own images by clicking on the Pictures option in the Insert Tab. This will open a selection box, so you can select the images that you would like to use in your dashboard software.
When you are adding images and charts to your presentation in PowerPoint, you will have the option to move it around the slide. You can move the image and the chart around the slide until you save it and change the file type.
3. Add Text
Text is important for explaining what you are showing with the software and can be used to create buttons to move viewers around the dashboard software. You can add a text box by clicking the Insert tab and then on the Text option. This will open a menu of different options for texts. The text box option will allow you to create any size of text box, so you can make adjustments to the text in the Home Tab and the font options.
4. Importing Information for Other Programs
If you want to import information from other Microsoft Office Programs, the fastest way of doing this is by opening the file that you would like to copy from and selecting the information to copy and paste into PowerPoint. You can link to the original file by highlighting the information and clicking on the ‘Hyperlink’ option found in the Insert menu. You can also link to websites and other slides using this method. The Hyperlink tool is going to be very helpful when you are linking your dashboard’s pages together. You can check if a Hyperlink is working by pressing control and clicking on the text because it should open the file or a web browser with the linked page.
5. Make More Slides
Once your first slide is done, you will need to create more slides to provide more information on a subject. You can use the ‘New Slide’ command on the Home page or the keyboard shortcut to do this. You can pick what the new slide will look like when you click on ‘New Slide’.
6. Designing the Slides
Designing the other slides that you can use to create your dashboard software does take time, and you can use the same methods that you used to create your first slide. You can connect this slide with other slides using the Hyperlink or the Cross Reference option in the Insert Menu. Each slide that is created should be linked back to the original slide to make using the finished program easy.
7. Creating the Dashboard
Once you have created all your slides and you have double checked that all the Hyperlinks and Cross References are working correctly, you will need to turn your PowerPoint into Dashboard Software. This can be easily done by clicking on the Slide Show tab. You will then need to click on From Beginning to view your completed dashboard. You should make sure that everything is working correctly when it is being viewed in Full-Screen mode, so all the clickable areas should link to the right page. To return to the editing screen, you will just need to click the esc key.
8. Fixing Mistakes
If there are mistakes or issues that you had noticed during the testing, you should fix them before saving the PowerPoint as just a presentation. The issues that you run into will depend on your presentation. One of the most common issues that people run into is that their Hyperlinks are not taking them to the right areas of their presentation. If this is happening, you should check the link by selecting the text or image and clicking on the Hyperlink option in the tool bar. This will show you where the link is taking you and you can fix it by adjusting the file, link or slide and then clicking Ok.
9. Saving
When your dashboard is working correctly, and all the information is on the slides, you can save it as dashboard software. This is done by saving the file as a presentation only. The file type will depend on the version of PowerPoint that you are using.
PowerPoint is one of the best options for when you want to create dashboard software quickly. It is very user-friendly software that most people use, so you may already have a good idea of how to create dashboard software. Most viewers will already know how to use PowerPoint slides, so they can easily use the software that you create.
10. Automation
You can use our DataPoint software to link your PowerPoint shapes directly to your data sources. The advantage of using DataPoint, or of linking slides to your databases, is that the information on your slides is updated automatically when you open the presentation. No more delays on manual updating of the old presentations.
Next to the update of the data at opening time, there is another great feature in DataPoint. You can create up-to-date snapshot presentations for distribution.
And finally, you can run your presentation as a slide show and all its content is updated in real-time. You can hang a television screen in your factory or meeting room and display your dashboard data, graphically and in real-time.


