
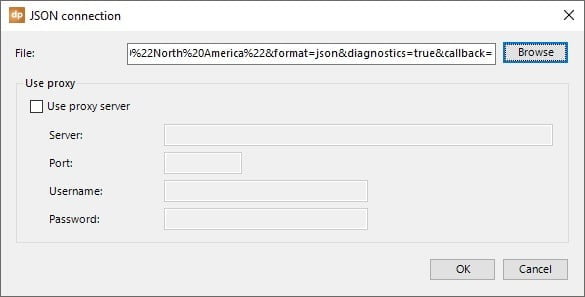
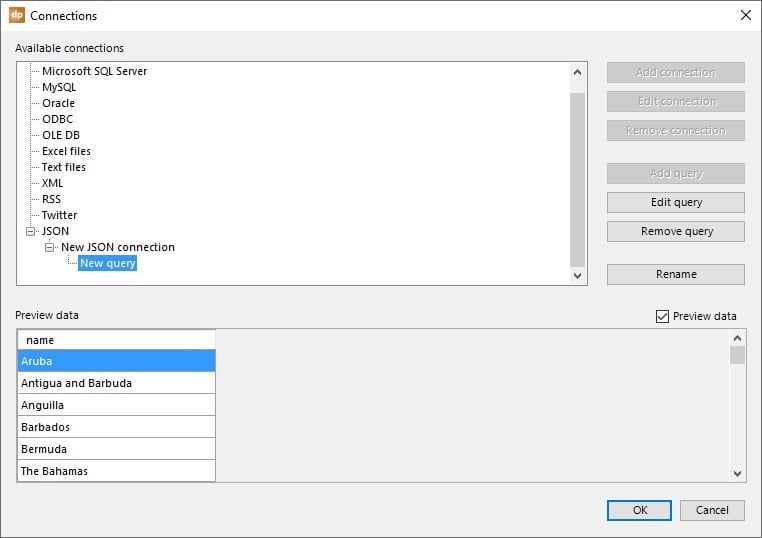
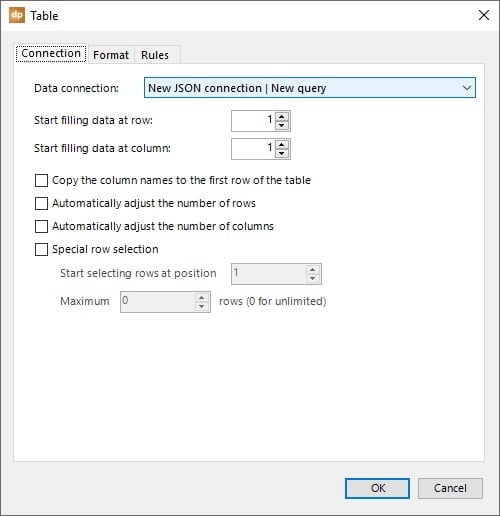
Similar to a database, a JSON file could hold one or more tables. That is why you first establish a connection to the file or url, and as a second step, choose which table to use on your slides.
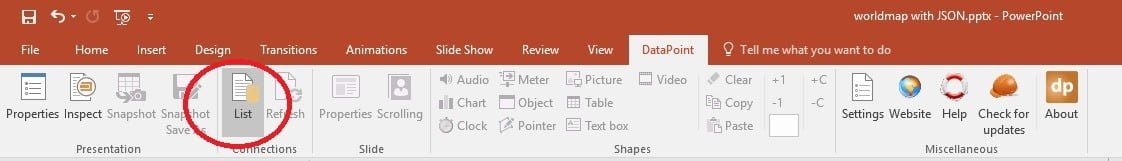
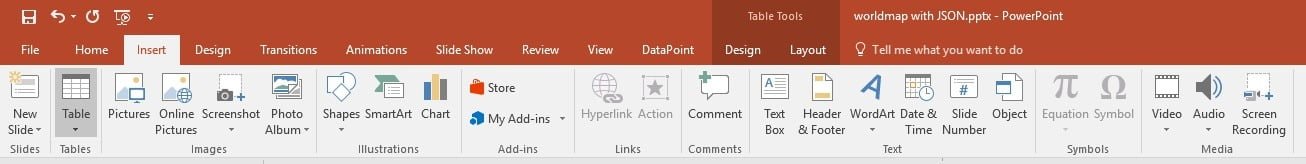
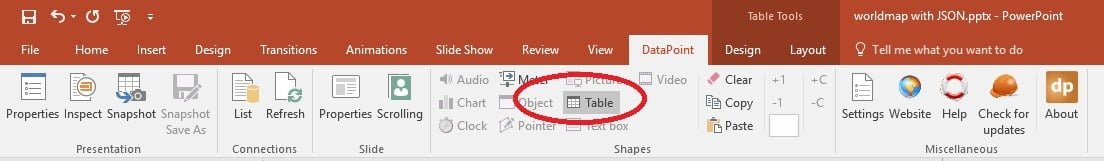
Click the DataPoint menu in your PowerPoint ribbon to start setting up JSON data connections. First click the List button of the Connections group in the DataPoint ribbon.

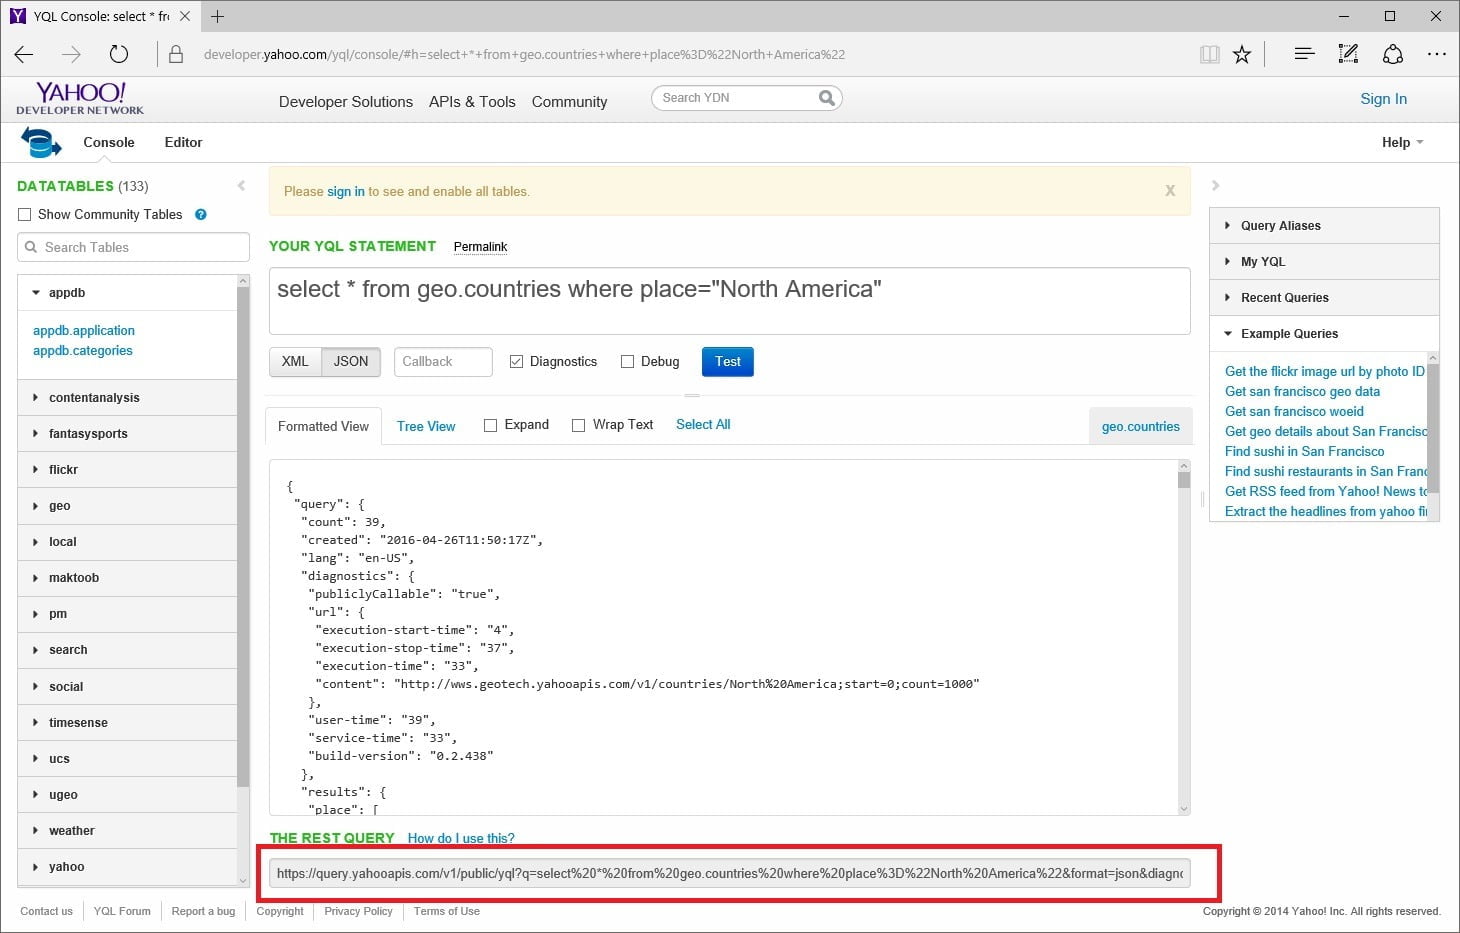
select name from geo.countries where place="North America"
to get a list of countries that are part of North America. You can choose to return the data in JSON or XML format. For this article, choose to return the data in JSON format.
The raw (truncated) response of this call, looks like this:
{
"query": {
"count": 39,
"created": "2016-04-27T07:57:34Z",
"lang": "en-US",
"results": {
"place": [
{
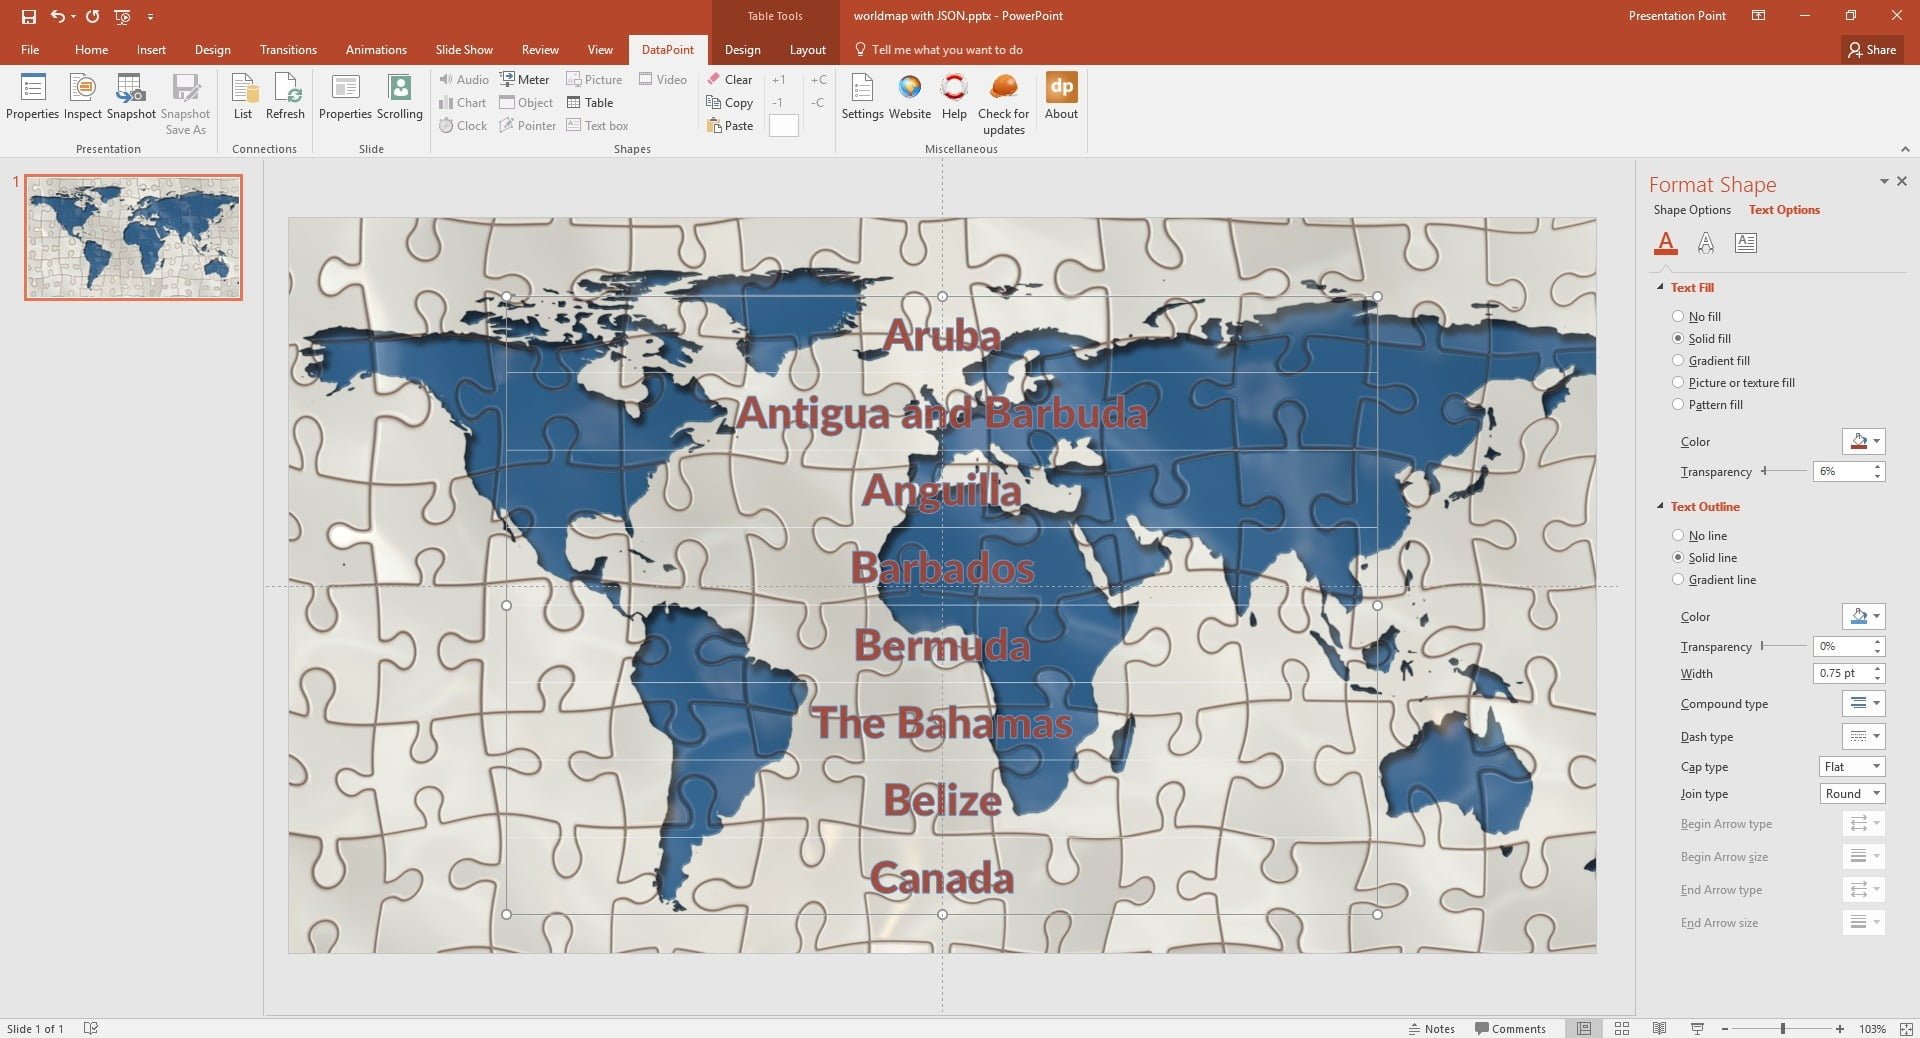
"name": "Aruba"
},
{
"name": "Antigua and Barbuda"
},
{
"name": "Anguilla"
},
{
"name": "Barbados"
},
{
"name": "Bermuda"
},
{
"name": "The Bahamas"
},
[TRUNCATED]
]
}
}
}
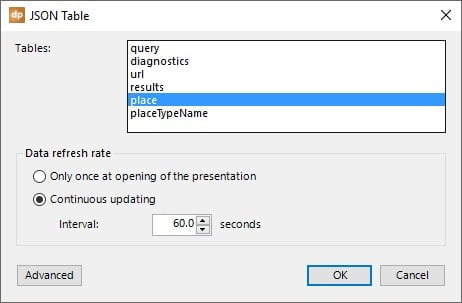
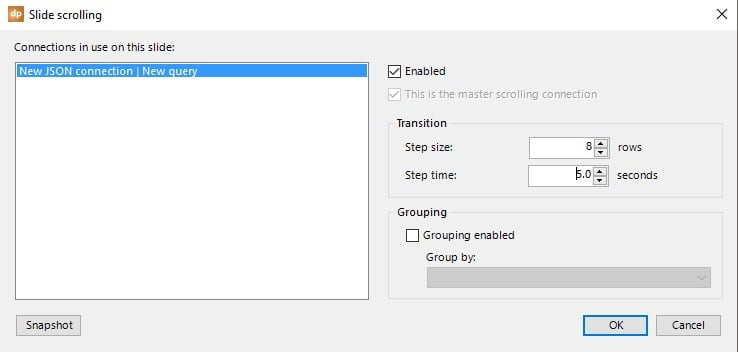
No problem for DataPoint. Click the Scrolling button on this slide, enable data scrolling for this connection and verify that the step size is set to 8. Hit OK to close and run your slide show.
Save Time with up-to-date JSON data in your PowerPoint


