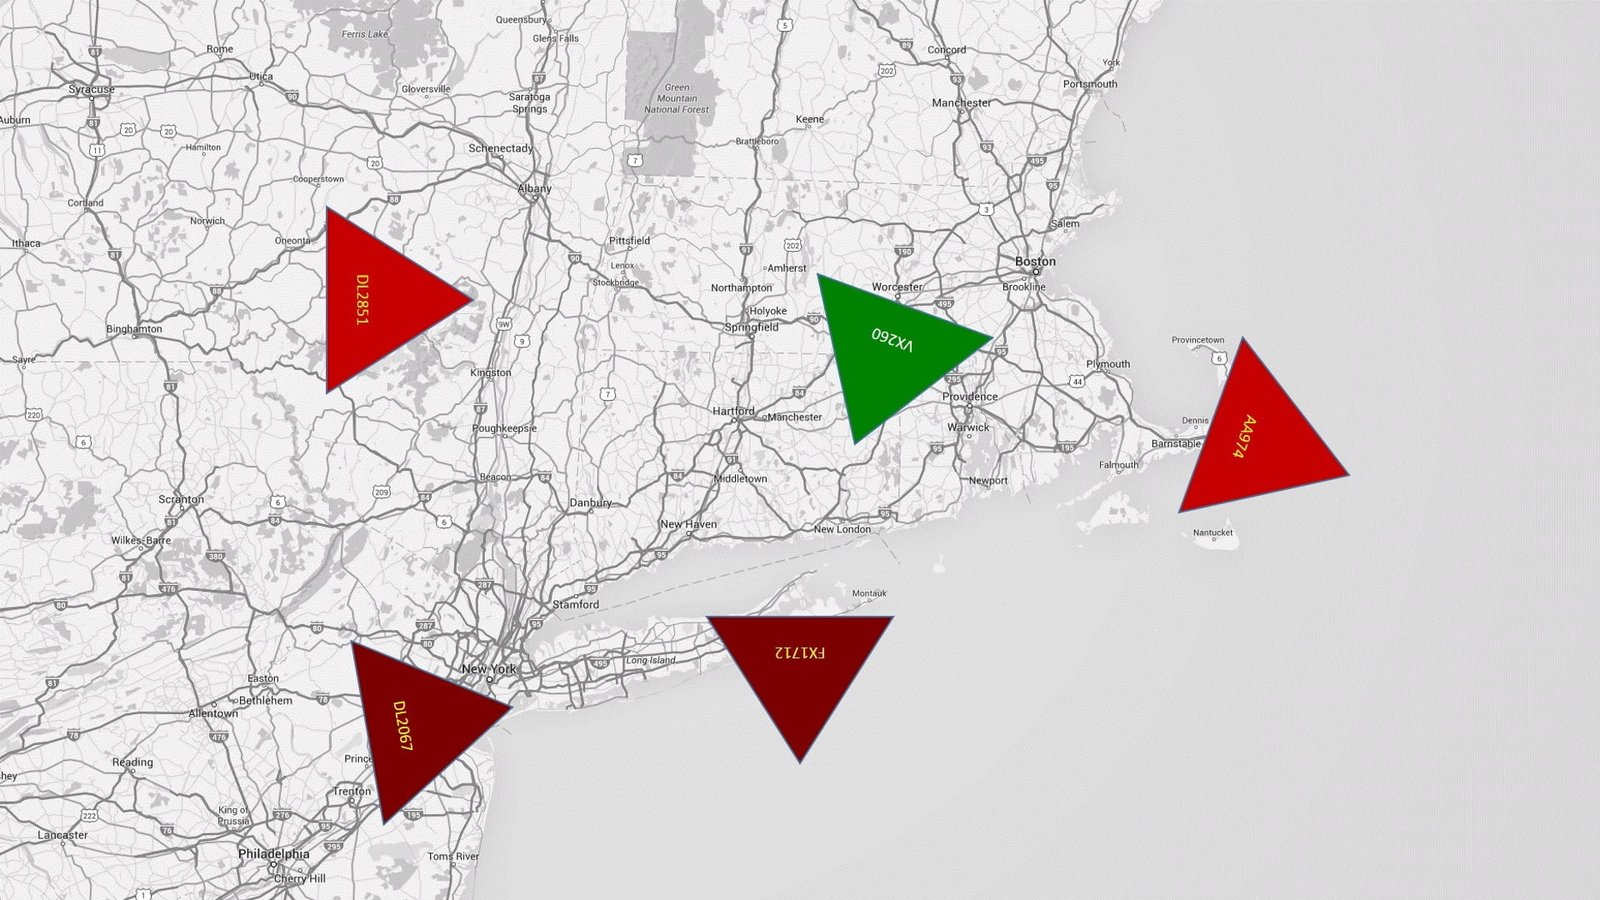
You can now display objects or shapes with dynamic positions on your slides, with a custom caption and moving positions. Imagine a map with real-time flight information, or a positioning system for trucks on roads, or any moving object on any map.
You can use DataPoint and PowerPoint to display items dynamically on any map, based on any data source. Let’s dive deeper into this new feature.
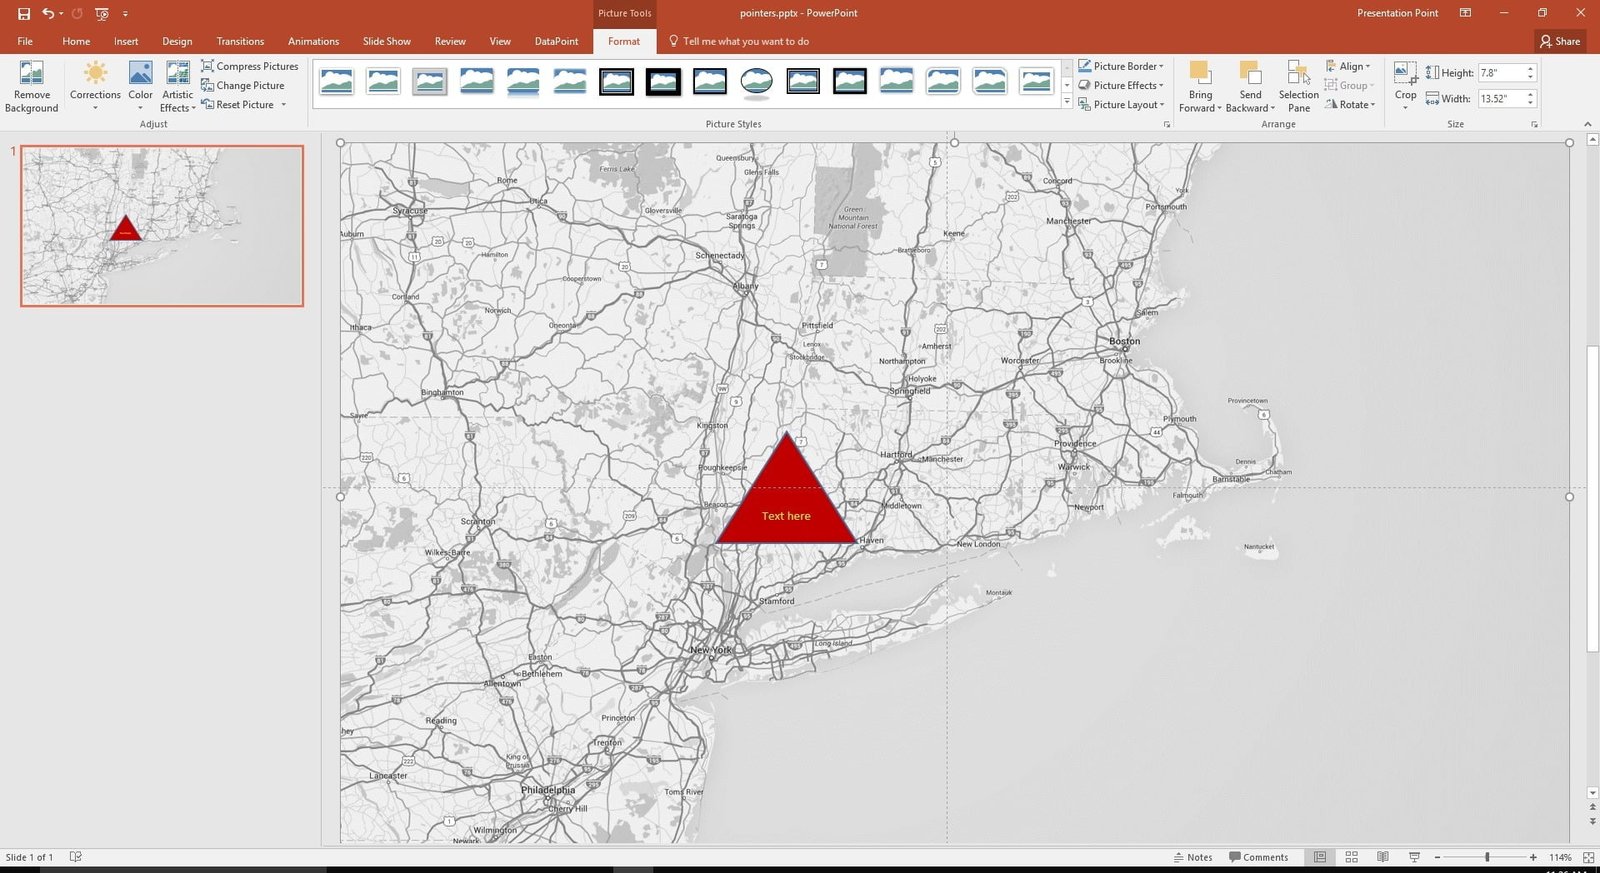
Let us start with a new PowerPoint presentation. Add a map of your area of interest to your slide like this and put a new shape on top of the image. This can be any shape that you can have in PowerPoint.
As an example here, we have some flight information and current positions in a Microsoft Excel file like so:
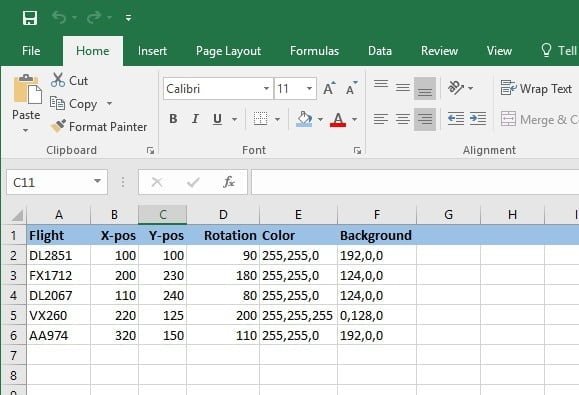
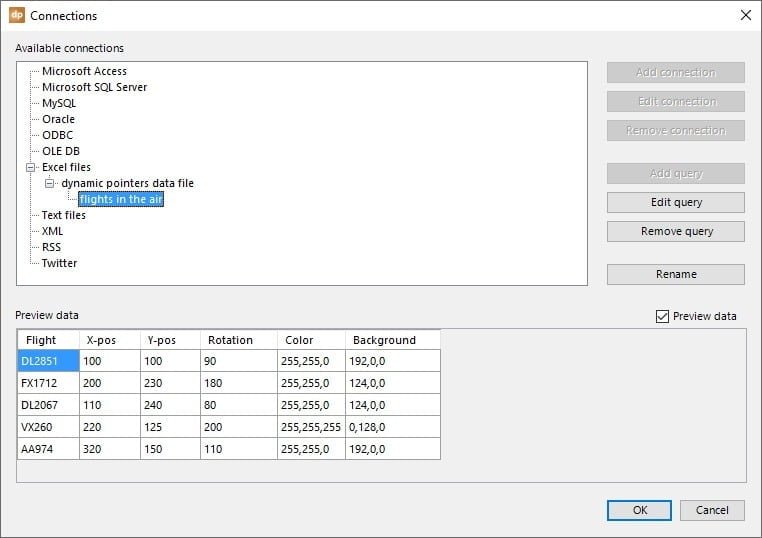

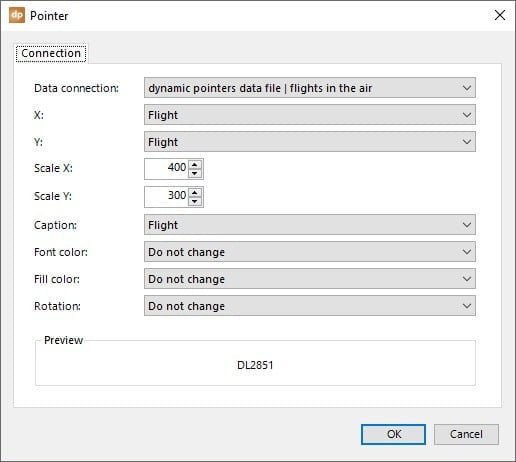
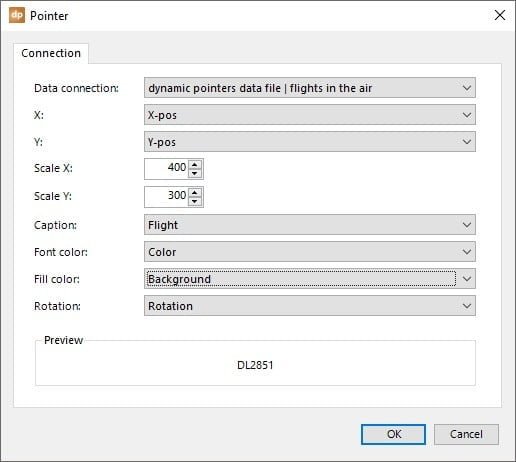
Then we select the columns that represent the X and Y coordinates. The scale X and scale Y represent the maximum values that you can have at your X and Y position. So scale X represents that maximum number of pixels horizontally on your screen. Scale Y represents the maximum size for your Y-axis or the vertical line on your slide or screen. So when your pointer needs to be exactly in the middle of your screen, and you have set scale X to 400 and scale Y to 300, then your pointer should have XY values set to 200 and 150.
Use the caption field to name your shape. Optionally, you can choose dynamic column to bind the rotation of the shape, the font color and the background color or shape fill color. All these values are optional values.
Rotation is a value between 0 and 360. Font color and background color are written as RGB values. This is 3 times a number between 0 and 255 for red, green and blue respectively.
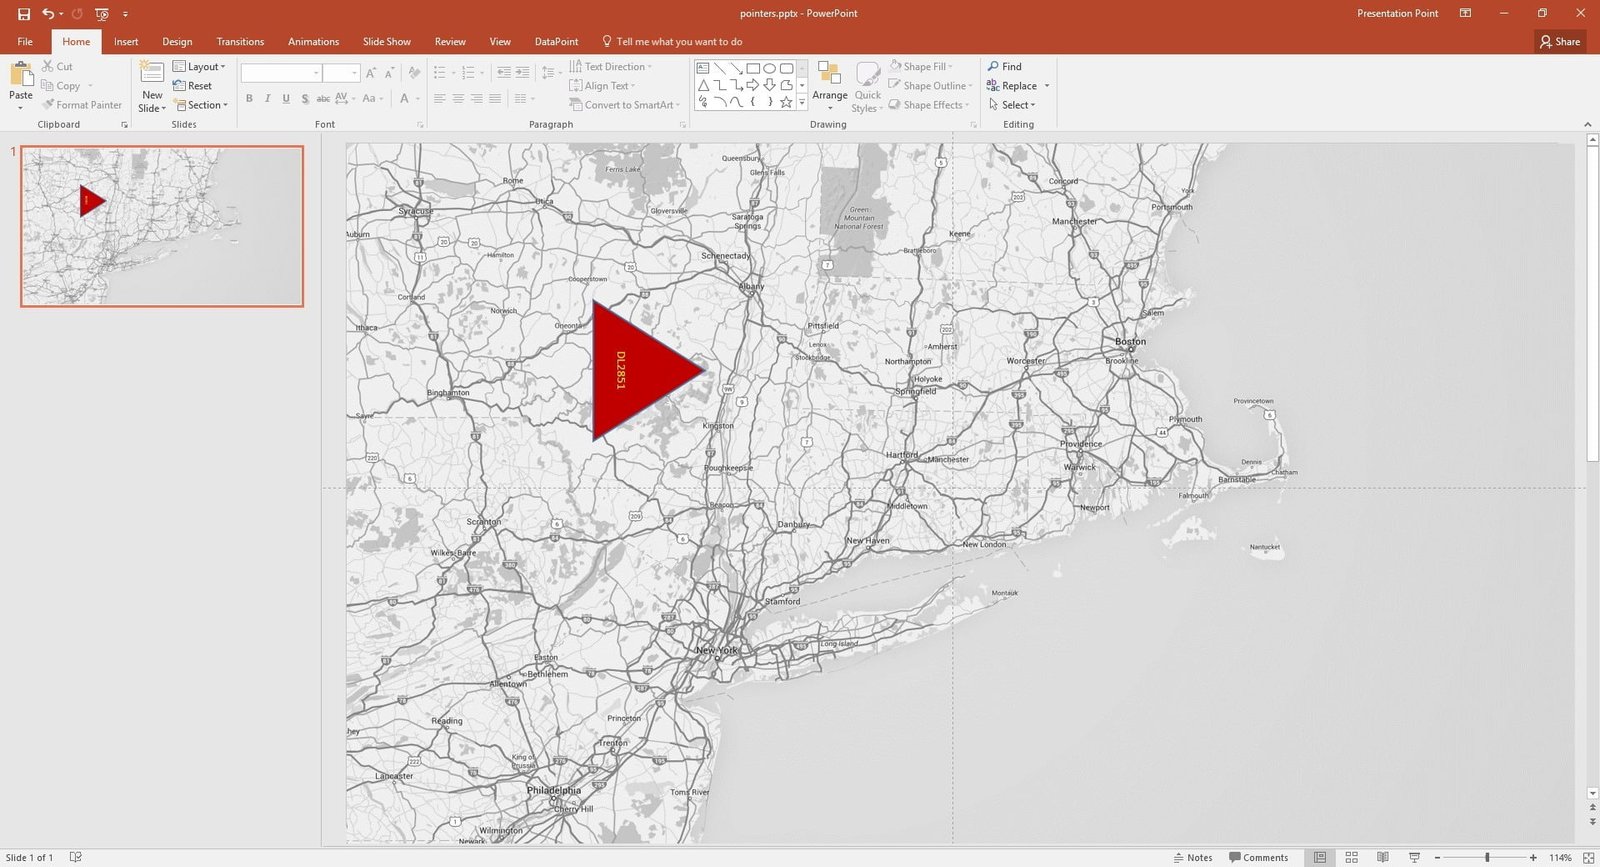
Start the slide show, and it will look like this screen below. You can update the data in the Excel file and DataPoint will move around your shapes, change positions, change rotations, change colors and so on. It will also add new shapes when you add new rows to your data, and drop shapes from the slides when you remove the corresponding data row.
