We have 3 possible scenarios for displaying weather.

  1. This is a dedicated weather add-on for PowerPoint to display weather information in a presentation. This is very easy to use and it can show current weather information and forecasts. If you need to display the weather information then use this option.
  2. When you need to display more than just a weather, try our DataPoint solution or combine with other Dynamic Elements add-ons. It has the same weather data provider (as in the first solution). This is very easy to use and can combine information from other data providers like database and Excel information.
  3. The weather information from any weather source or weather API is typically communicated with XML or JSON format. DataPoint can use any XML or JSON data feed. So, if you want to have a full flexibility yourself, then take full control with the XML or JSON data providers of DataPoint.

This blog article covers option 3.

Normally we use Yahoo Weather as a weather API because it is good and free to use. But recently, a customer needed a weather display with weather information per hour of today. This type of information, hourly weather forecasts, is not available in the Yahoo Weather API, so we had to look elsewhere. Forecast.io is another weather data provider, with a free and paid plans, and is providing this hourly weather information that we need. Let’s explore the capabilities of Forecast.io. Jusr recently the Forecast.io service was renamed into Dark Sky.

Sign up at Forecast.io and get your API key in order to retrieve data. Documentation of what and how to retrieve weather information, can be found here.

Typically a call looks like this:

https://api.forecast.io/forecast/APIKEY/LATITUDE,LONGITUDE

The APIKEY is the unique key that you get from them and identifies you and your application. The latitude and longitude are geographical coordinates to identify a location or city. In this article we will create a dynamic weather display for Rome in Italy. So we have to look for the coordinates of Rome. Use the Google search engine for this.
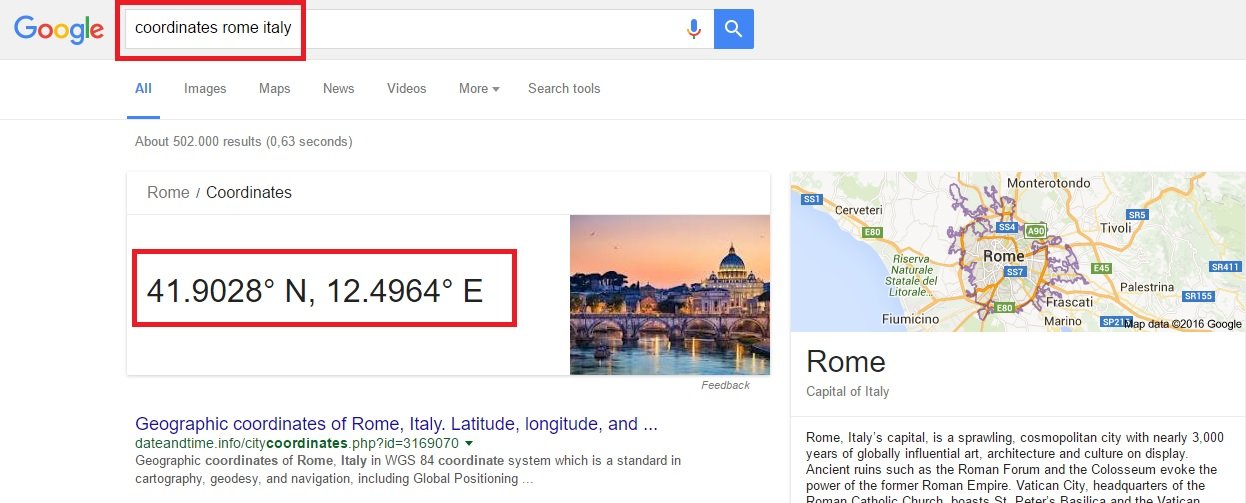
 

look up weather display city coordinates via google
With this geographical information, we can now rewrite the API call like:

https://api.forecast.io/forecast/52cec5ff313a4d19b60540cfe89675a5/41.9028,12.4964

52cec5ff313a4d19b60540cfe89675a5 is our API key that we got from our sign up process at forecast.io. We will change this API key after publication of this article. So use your own API key instead. Using this key in your weather display presentation will not work. You will have to use your own key. The reason for this is that, you will get a free number of calls per day, and otherwise we would exceed that number of calls if everyone would use the same together.

41.9028,12.4964 are the coordinates for Rome, Italy, as we got them from our Google search.

We can use DataPoint to link PowerPoint to this weather service.  Click DataPoint in the PowerPoint ribbon and click the List button.
datapoint menu in powerpoint
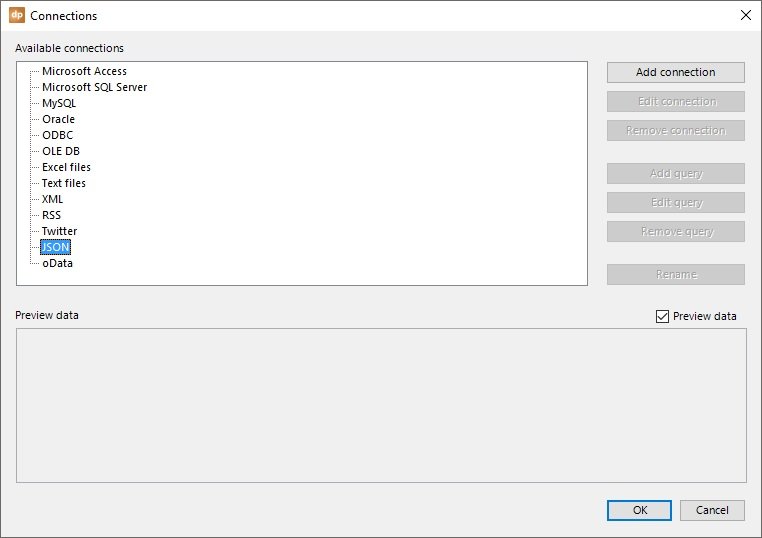
Select the JSON node at the list of possible providers and click the Add Connection button. JSON is used by forecast.io to exchange the information between 2 applications.
add weather connection to powerpoint
For the connection, we will use this call:

https://api.forecast.io/forecast/52cec5ff313a4d19b60540cfe89675a5/41.9028,12.4964?units=si&exclude=currently,minutely,hourly,alerts,flags

There are some extra parameters added for this purpose. Units=si returns the information as degrees in Celsius. And we want to include daily information only.
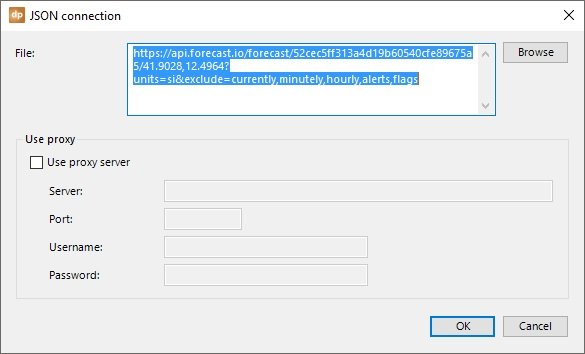
api call to forecast.io
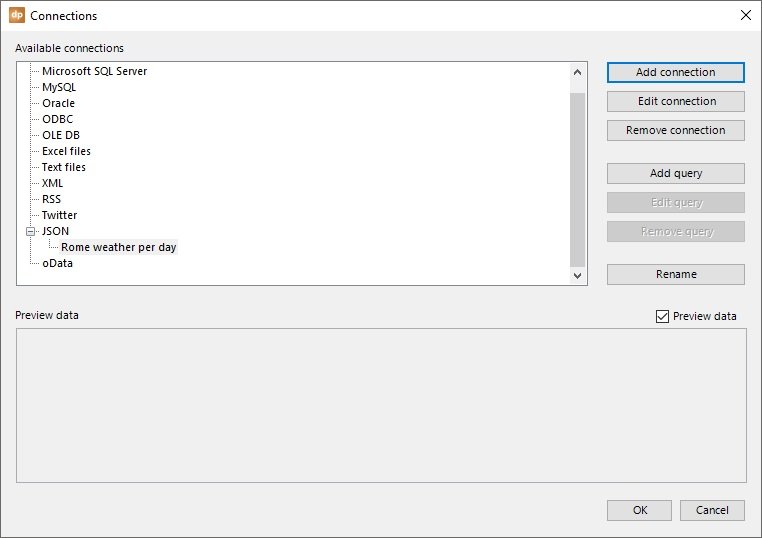
Click OK to close. Name the connection and click the Add Query button.
add weather query to connection
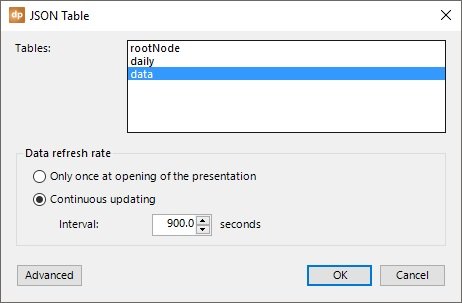
The information we need was stored in the data table. Select it. Set the refresh rate to 900 seconds, or 15 minutes. Click OK to close.
link to data table
At this stage, we have a first connection and query established for the forecasts per day. We need to add a new connection for the hourly information of today. Add a new connection by clicking the Add Connection button and set the URL this time to:

https://api.forecast.io/forecast/52cec5ff313a4d19b60540cfe89675a5/41.9028,12.4964?units=si&exclude=currently,minutely,daily,alerts,flags

You will see that currently, minutely, daily, alerts and flags are excluded and that basically only hourly intervals are included with this call.
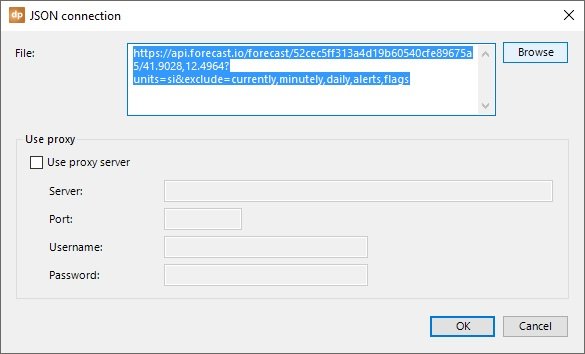
weather connection per hour for weather display
Here again, select the data table and set the refresh to 900 seconds.

Click OK to close and now we have 2 weather queries set up in our PowerPoint presentation. Now the fun part starts as we are going to use the information on our weather display slides.
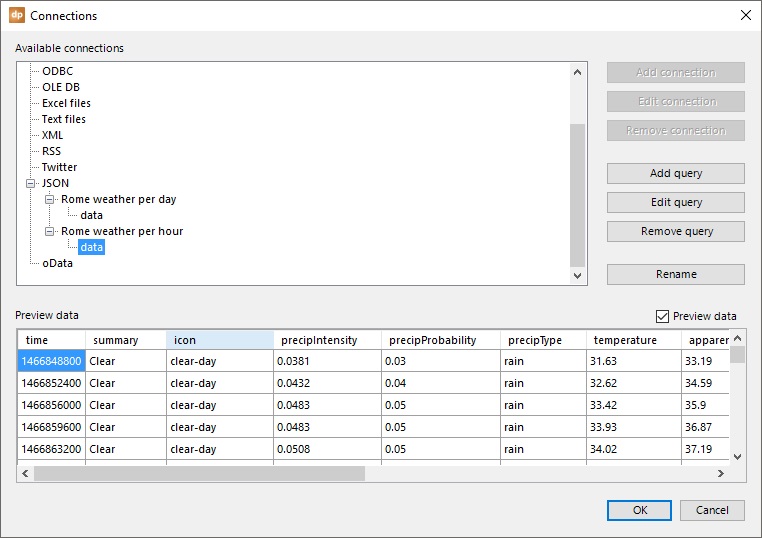
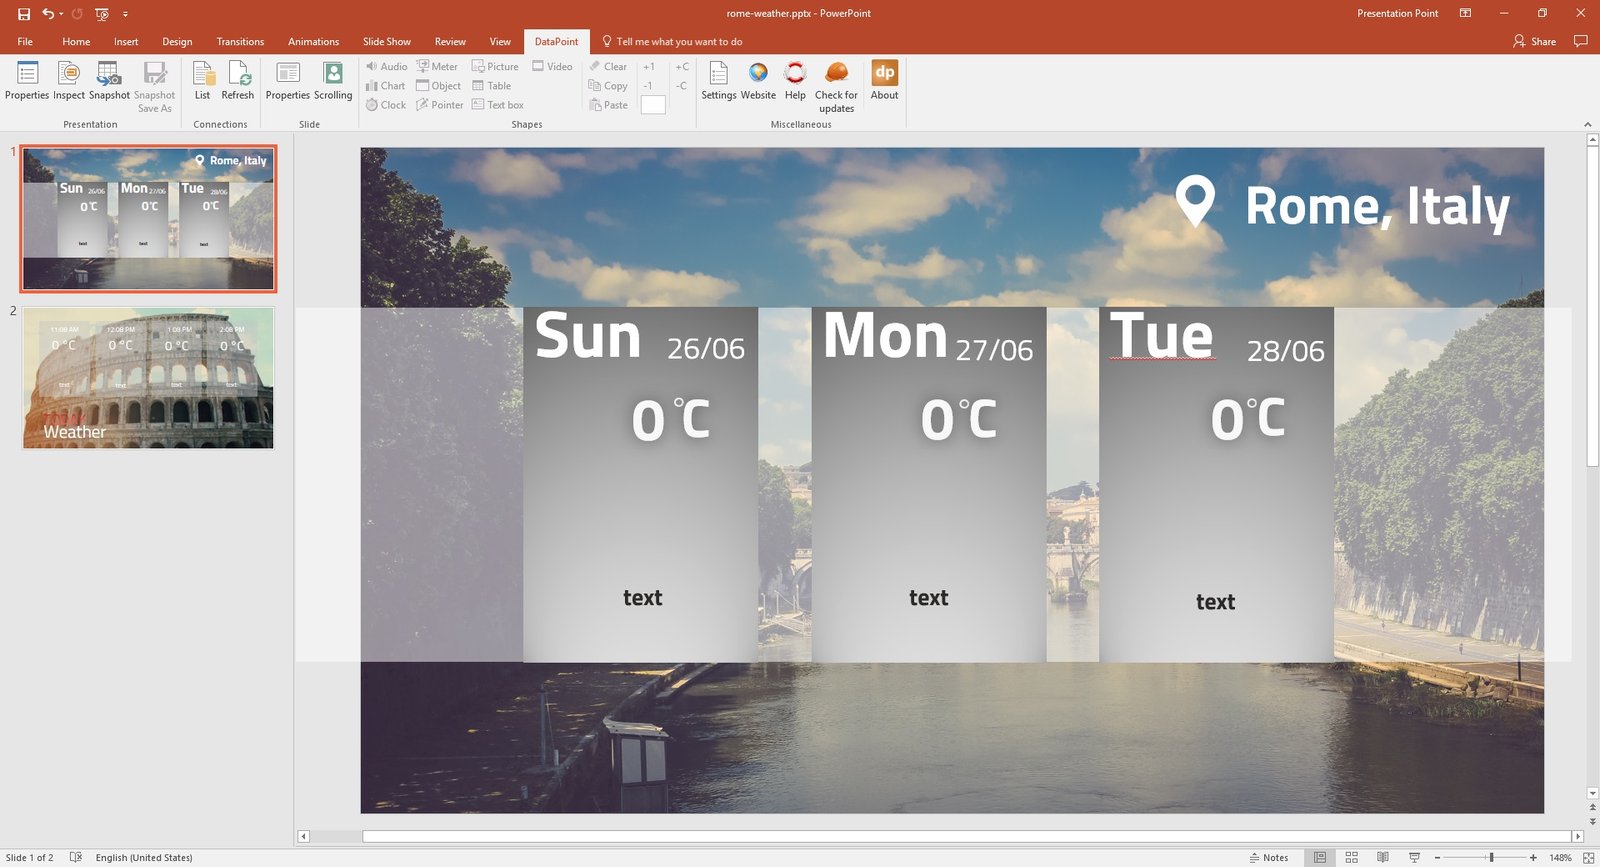
weather display connection overview
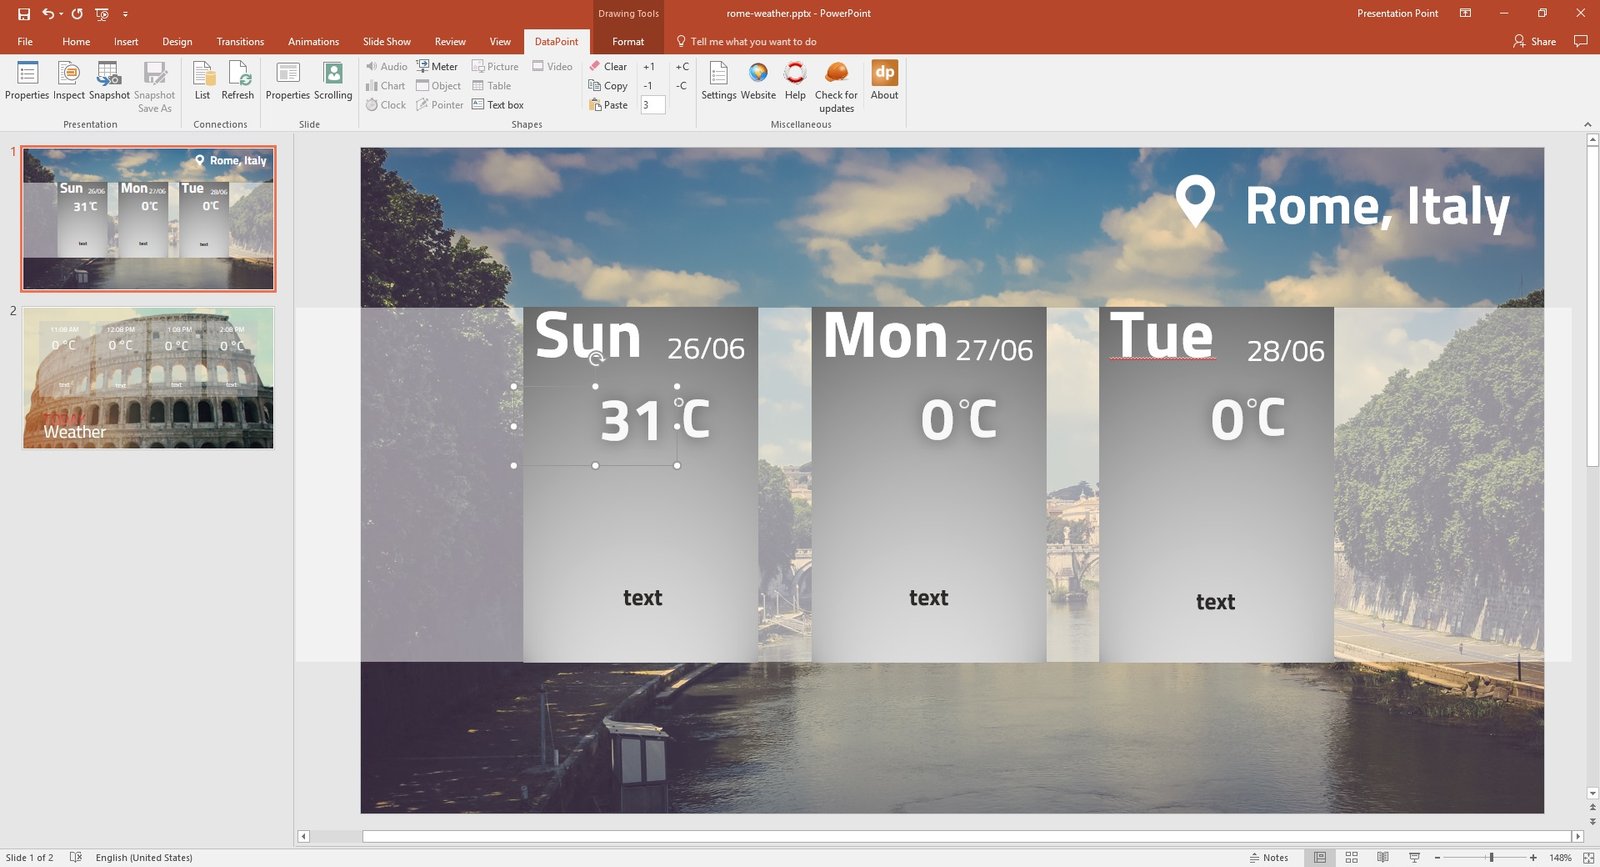
We designed our presentation like this:
powerpoint presentation design for weather display
Select your text box to host the temperature value and click DataPoint menu then click Text box to open its properties.
textbox menu
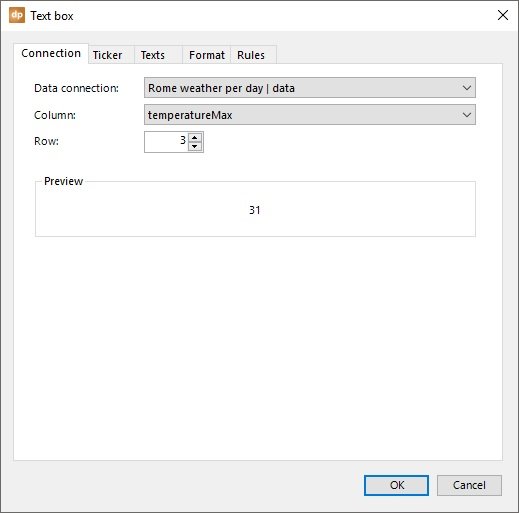
Open the list of connections and choose the connection named Rome weather per day | data. Choose the column name TemperatureMax and set the row number to 3. Row 1 is for the past hour, 2 for the current hour and 3 holds the info for the next hour, what we want to display. Click OK to close.
text box for temperature
The text box will now show the dynamic temperature value from our data source.
text box linked to temperature
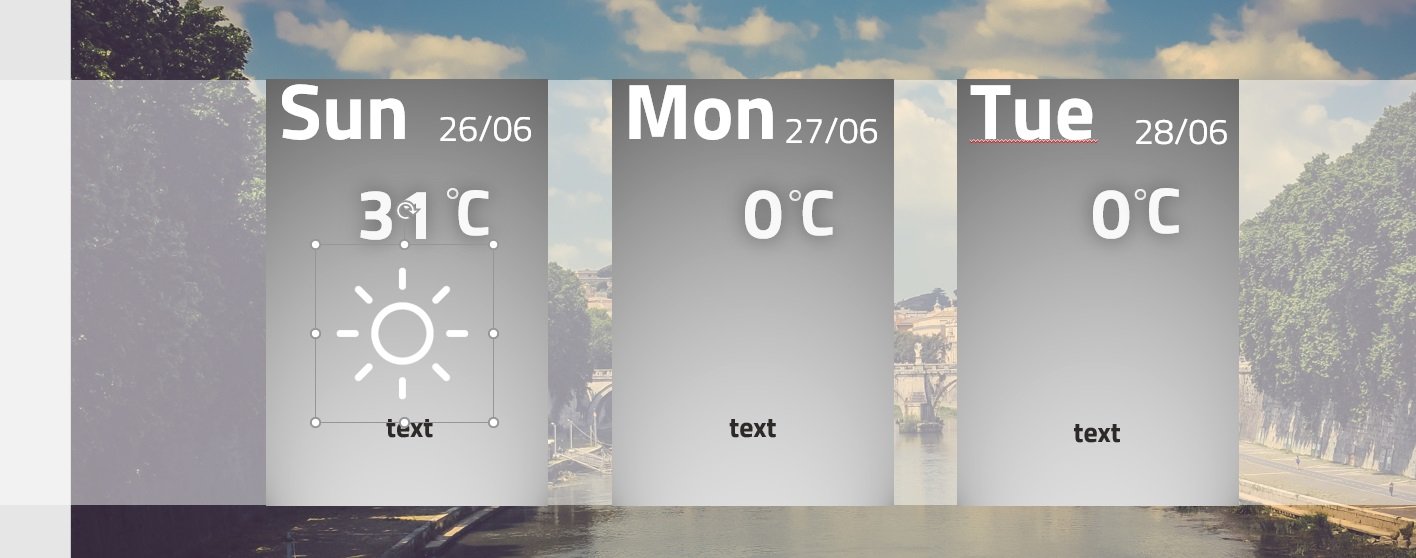
For the weather icons, insert a default weather icon to your weather display slide. Click Insert then Pictures and select a default icon. Place this on your slide.
insert a picture on slide
Select the inserted image and click DataPoint, Picture in order to dynamically link it.
datapoint picture menu
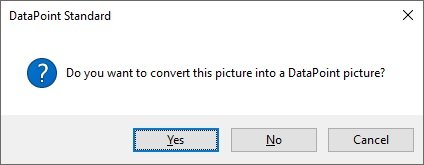
It asks to convert the normal picture into a dynamic or DataPoint picture. Choose Yes.
convert picture to dynamic picture
Set the connection to Rome weather per day | data and choose icon as column. Set the row number to 3 for the info of the next hour.

At the option The data of the selected column contains, switch it to filename only. Set the folder to .\icon set 1 and enter png as an extension.

The weather API communicates the weather status as words like clear-day, clear-night, rain, snow, sleet, wind, fog, cloudy, partly-cloudy-day, or partly-cloudy-night. We have a folder with all these words as images. That is how we can translate a weather condition text into a weather icon.

Click OK to close.
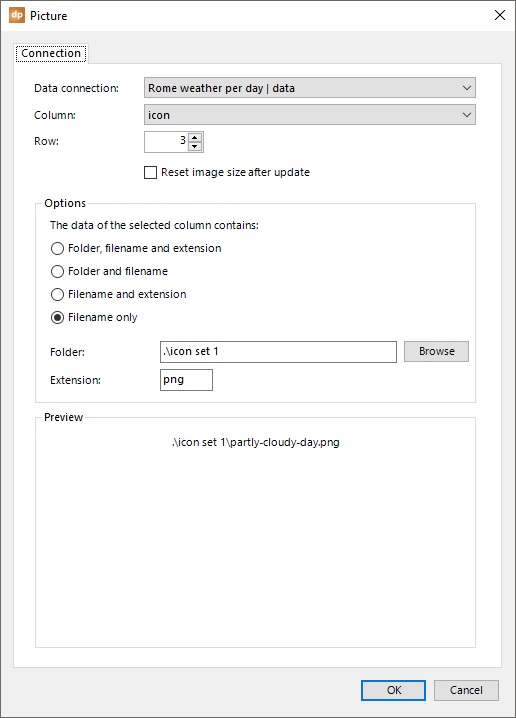
 

dynamic picture properties
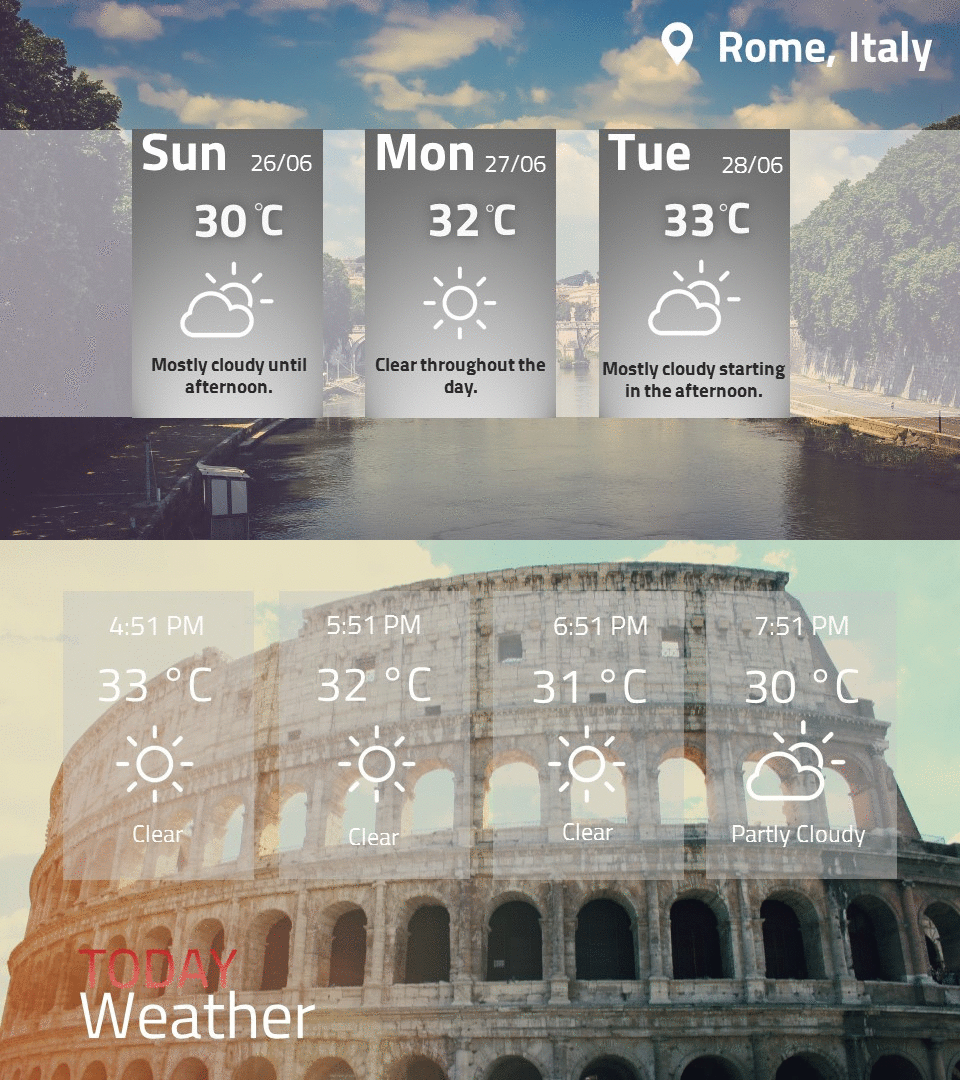
Complete all text boxes and images on all slides, and link all to the various weather information. Save it and run the slide show.
dynamic weather slide show
While the weather display slide show is running, DataPoint will communicate with Forecast.io every 15 minutes about the weather information of Rome. Whenever a new value like temperature is detected, DataPoint will update the information in the text boxes without stopping and restarting the slide show. All updates will happen while the slide show is running.

Download DataPoint for dynamic weather info

Get this free presentation with weather icons