In this video and article, we will show you how to make a simple waiting room digital signage appointment screen using PowerPoint and DataPoint. The video shows the step-by-step process, but we have also laid out the process in this article.
Medical waiting rooms are a scary place.
Patients are usually there because they aren’t feeling well in the first place. Add to that the apprehension over needles, tests, or whatever other medical procedures will need to be done and you can see why patients are anxious and impatient while waiting.
As the patient sees other patients being taken in, they may wonder if they have been missed and may come up to the counter to check and see how long it will be before they are seen. A great way to assure patients that they aren’t forgotten is to set up a waiting room digital signage appointment screen.
You can show all of your current appointments on one screen so that everyone sees at a glance how many people are ahead of them, who is next, and even when their appointment time is coming up.
This also helps with managing staff workload as well as building confidence in your practice among clients.
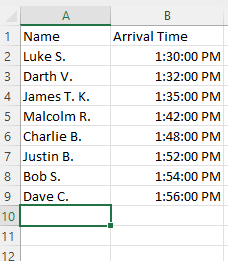
We started off by creating a simple Excel spreadsheet that clinic workers could use to update appointments.

Next, we created a simple PowerPoint presentation, adding the medical clinic logo, title, and blank table.

Now, we create our connection between the PowerPoint presentation and the spreadsheet by clicking on the [List] command in DataPoint

From our [List] command choices, we are going to scroll through the available connections until we find the [Microsoft] category, then choose [Microsoft Excel] and then [Add Connection].

When you click on [Add Connection] the program will prompt you to find and click on the Microsoft Excel file you want to connect to. [Browse] to find the file and click on [Ok] to make the connection.

Now we need to add a query. Click on the [Add Query] option.
You will want to click on the [First Row Contains Names] option and change the [Updating Interval] if you want. Then click [OK].

Now, you will see a preview of the data. You will notice that the time column has a weird date included showing all your patients as waiting since Dec 30, 1899! Bad news that they have been waiting this long, but great news that your patients are so long-lived. No wonder you have people lining up for your clinic! 😀
This is just the default way that data is stored in Excel for the time format. We will show you how to get rid of this in the next few steps.
It is a good practice to rename both your connections and queries so you can find them later, especially if you might also be connecting a presentation to more data sources or news and weather.
Click on [OK] to go to the next step.

Now, we are going to connect the table in the presentation to the data. Click on the table in the presentation, then click on the [Table] command in the [DataPoint] menu.

After clicking on the table and the DataPoint [Table] command, you will browse your connections to choose the one you want. Also tick the boxes for [Copy the column names to the first row of the table] and to automatically adjust the number of rows.

Now the time is there, but it has added 1899-12-30 in front of it! So we fix this by selecting the dates and clicking again on the DataPoint [Table] command and then clicking on the [Format] tab. Then you choose [Date and Time] and select the format without the entire date.

Once the date format is fixed, the table is ready. You can do some cosmetic work such as adjusting the colors.
Run the PowerPoint on your waiting room digital signage, and the table will automatically update as your staff updates the excel spreadsheet.
Reach out if you have questions on how to set up your own waiting room digital signage.


