
How do I add a ticker symbol using DataPoint? Something like this where it would auto update and we could do several other companies…
We were recommending the Yahoo API for that earlier, but Yahoo has been shutting down some data services. We have found another great and free resource for this purpose of showing a ticker symbol real-time in PowerPoint.
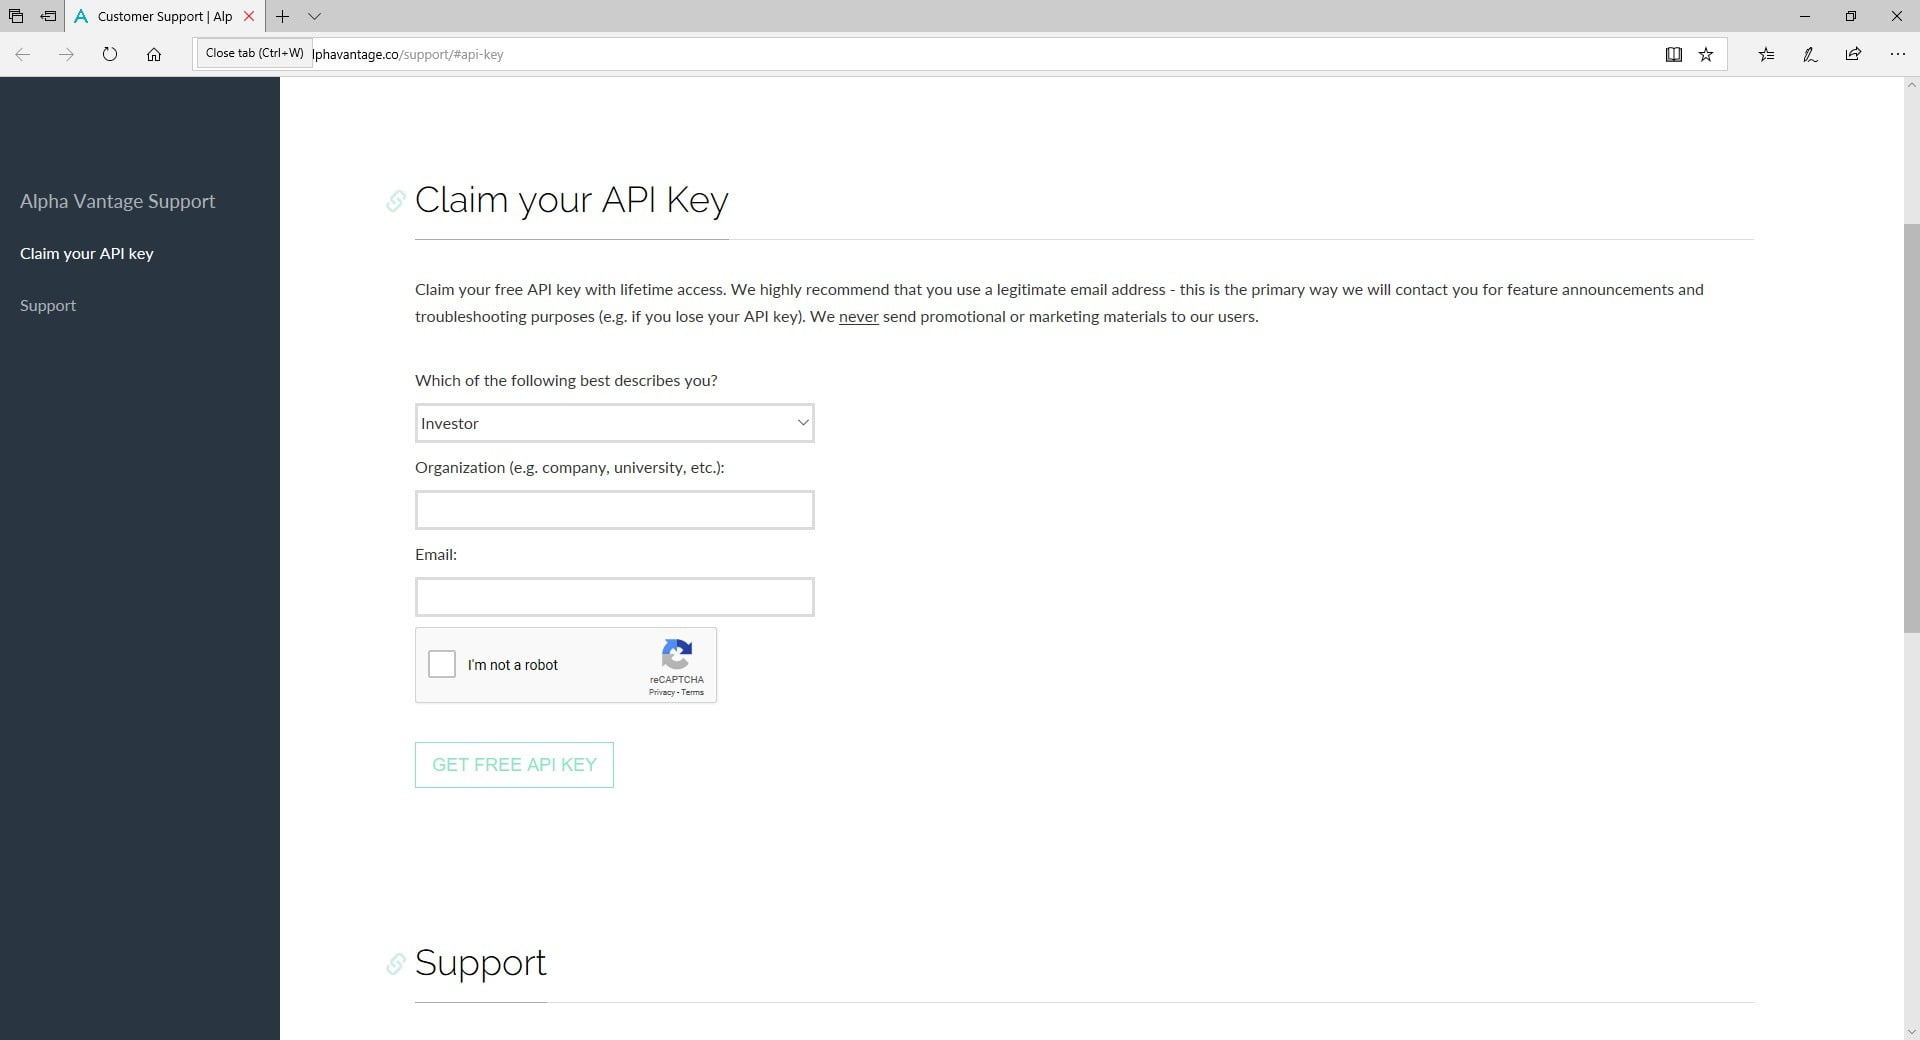
First, sign up for a free API key at Alpha Vantage. After registration with your email address, you will get an API key that you have to use in every call to their API to identify you. This API key is just a text string that you have to copy.
The company Mettler-Toledo International Inc. is listed as MTD as the New York Stock Exchange. To get its information via Alpha Vantage, you can call this URL:
https://www.alphavantage.co/query?function=GLOBAL_QUOTE&symbol=MTD&apikey=YourAPIKey
Remember to replace the text YourAPIKey with your key.
The output looks like this and is available in JSON format:
{
    "Global Quote": {
        "01. symbol": "MTD",
        "02. open": "747.9600",
        "03. high": "747.9600",
        "04. low": "736.1700",
        "05. price": "739.1600",
        "06. volume": "102535",
        "07. latest trading day": "2019-05-01",
        "08. previous close": "745.2600",
        "09. change": "-6.1000",
        "10. change percent": "-0.8185%"
    }
}
JSON is one of the data providers that DataPoint can handle.
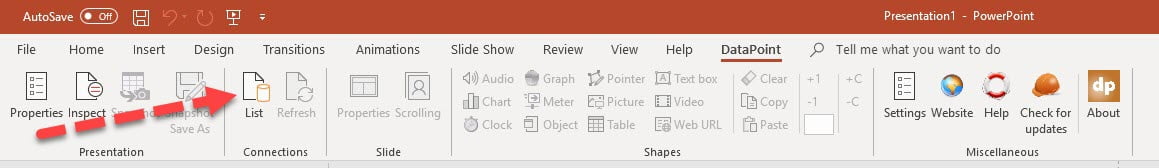
Click DataPoint in your PowerPoint ribbon and then click the List button of the Connections group.
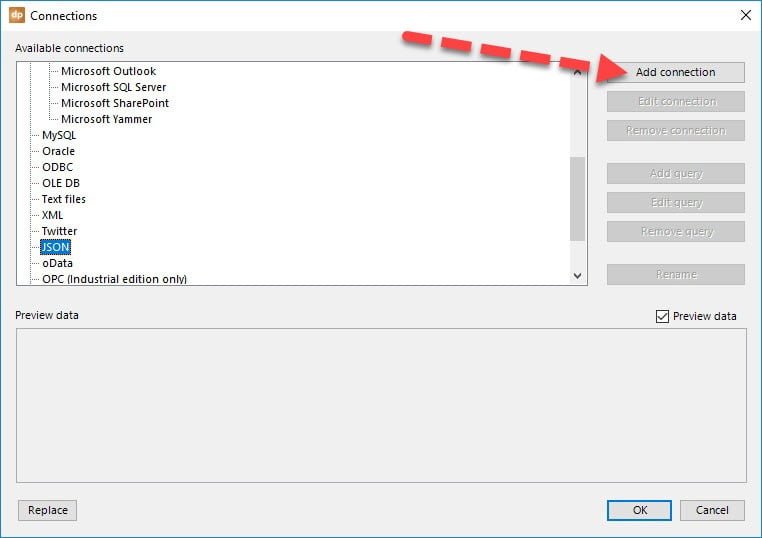
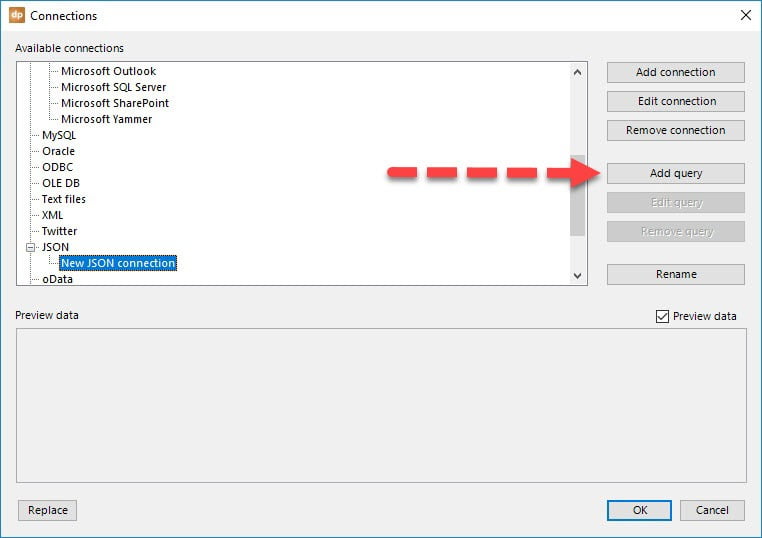
Select the JSON node from the available data providers in DataPoint and click the Add Connection button.
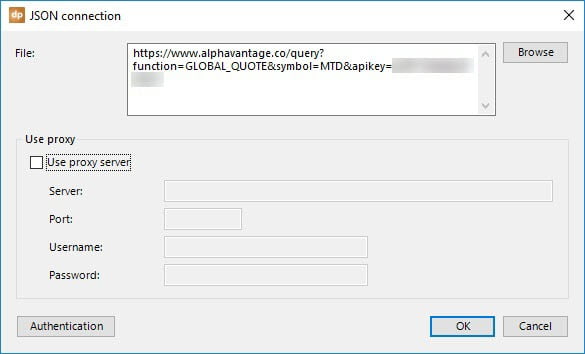
Paste the URL in here to get your desired information.
With this newly added JSON connection selected, click the Add Query button.
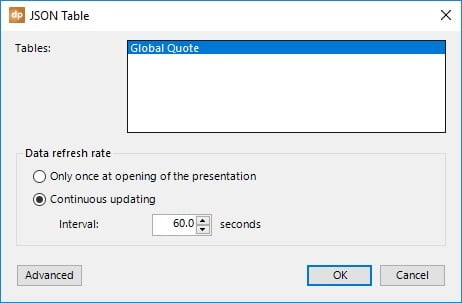
Select the only present table named Global_Quote. Verify the data refresh rate. With a value of 60 here, DataPoint will check for a new updated value every minute. Whenever a change is detected, the value in this textbox will be updated while the slideshow, later on, is running.
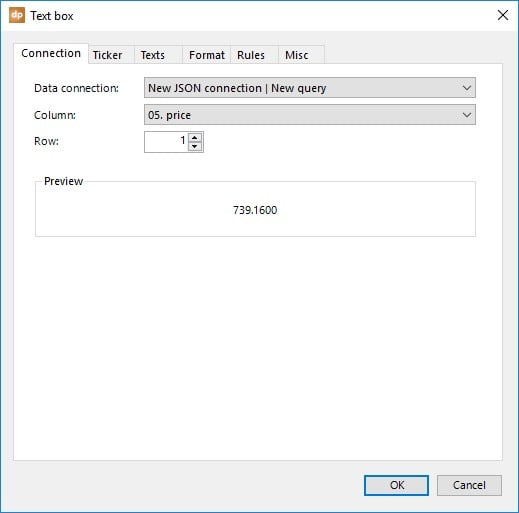
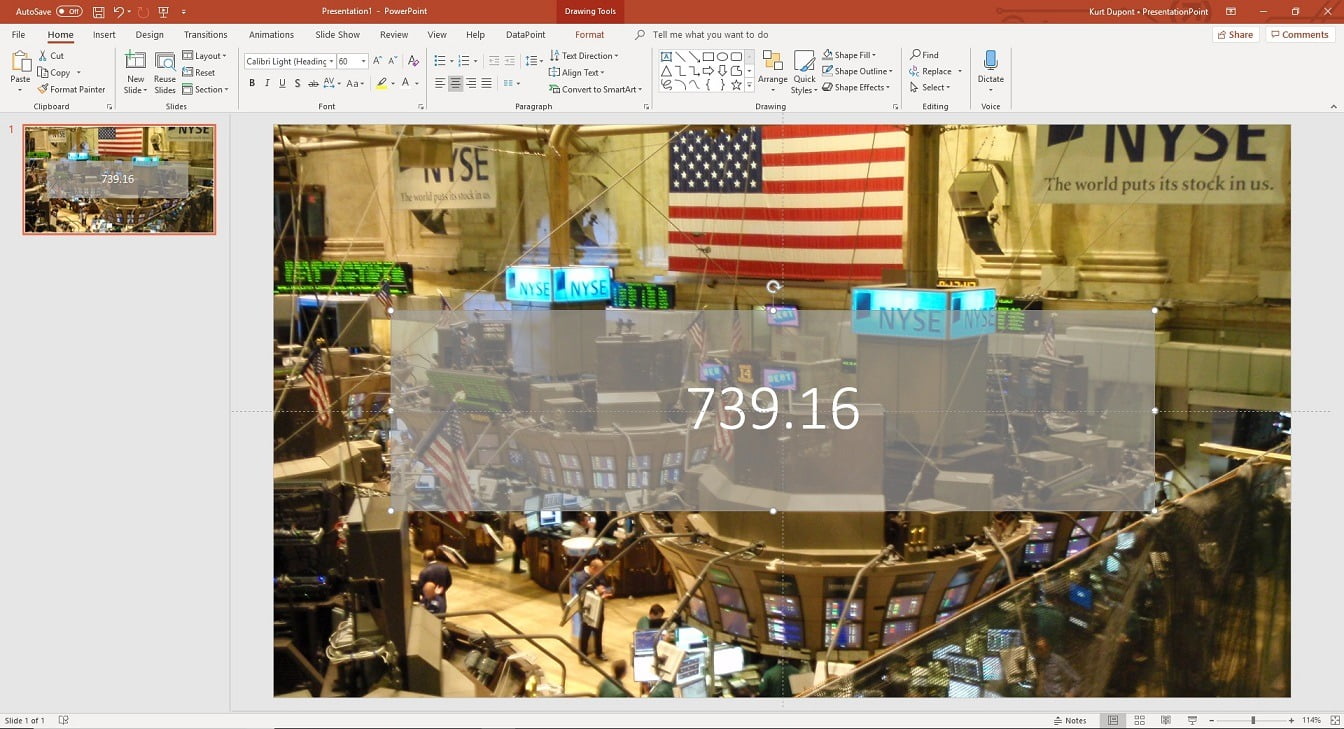
Select a text box of your slide and click DataPoint, Textbox button. Assign the content of this text box to the JSON query that we have set up earlier, and choose to display column 05. price here.
Click to open the Format tab and set it to be formatted as a number with 2 decimals showing.
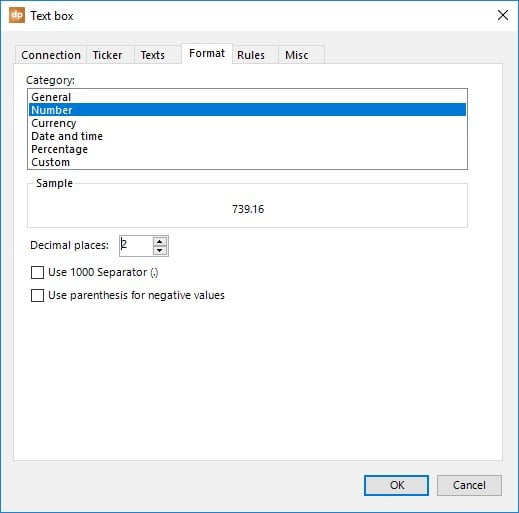
Now click OK to commit the changes and this text box will always show the latest stock quote.
Set the slideshow type to kiosk so that it will loop forever. Optionally you can add more slides with other information.

While the slideshow is running, DataPoint will check the API data source every minute and update the value on your slide whenever a new value has been detected at the data source.


