
 First of all, why would you like to display database information in a presentation? Look around you! You are surrounded by data enabled presentations. Take a train station as an example. The LED screens and VGA computer screens that you see in a train station, are presentations with variable real-time information. This is an attractive way of communicating the latest information to travelers. Needless to say, when train is delayed, it needs to visualize this change of data immediately to the passengers. When a train switches tracks in the last minutes, then you should signal this important change too. Same story at an airport. But also at less time critical places you can display real-time information like teacher absences in a school, class room changes, general announcements and messages in an office or factory or parking lot, theater information, advertising and much more. But also for offline reporting and statistical presentations, where you present the latest production or sales figures, then it is beneficial to connect your presentation to your database to display the latest information.
In this article I will show you 3 different ways to display information of a database in your PowerPoint presentation by using the DataPoint add-on. These 3 methods are very close to each other but they all have their own characteristics and (dis)advantages.
Preparation
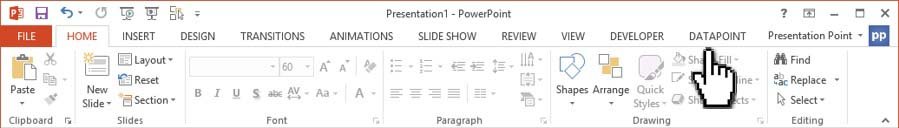
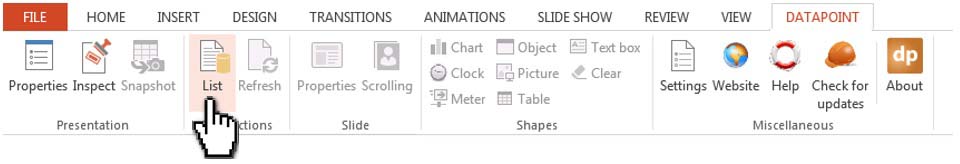
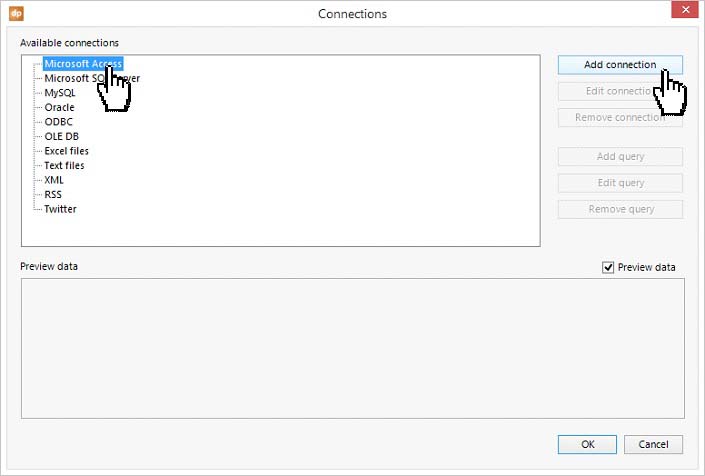
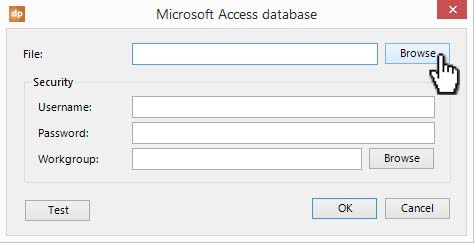
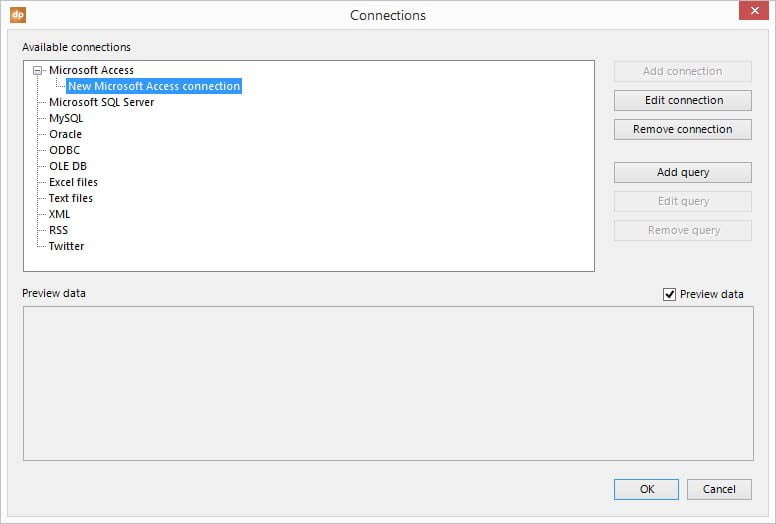
With DataPoint installed, first the user should have to identify the database that the user wants to connect to and use in the presentation. Common used databases are Microsoft Access, Microsoft SQL Server, Oracle, MySQL and more generic connections like ODBC and OLEDB connections. In this article we will use the sample Microsoft Access database northwind.mdb. First click DataPoint in the PowerPoint menu.
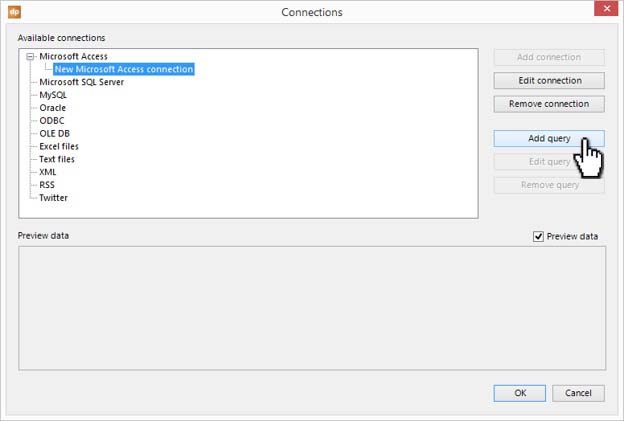
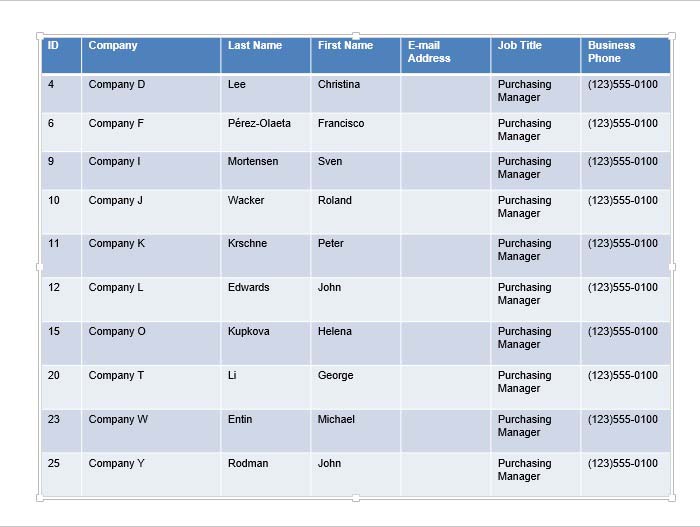
First method: linking a table directly
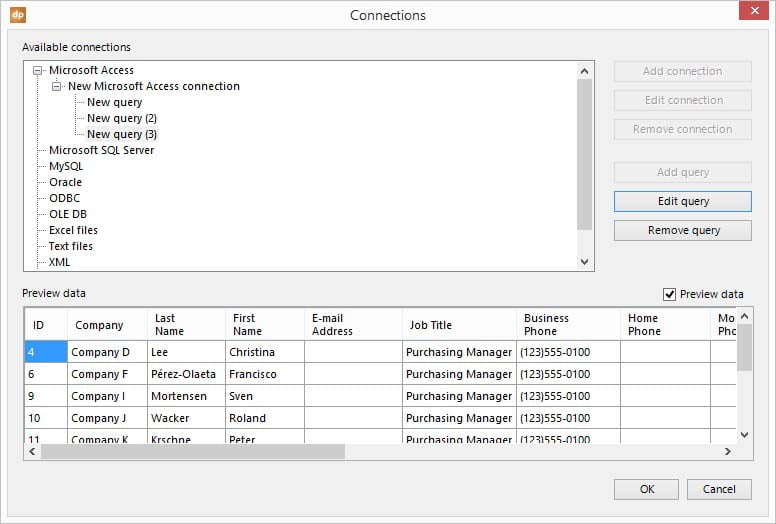
Make sure that the added connection is selected and click Add query.
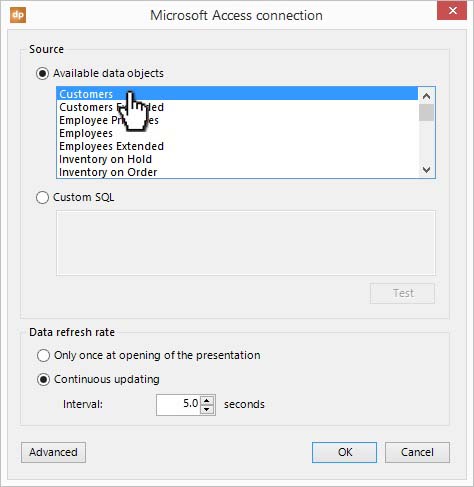

Second method: use a database query
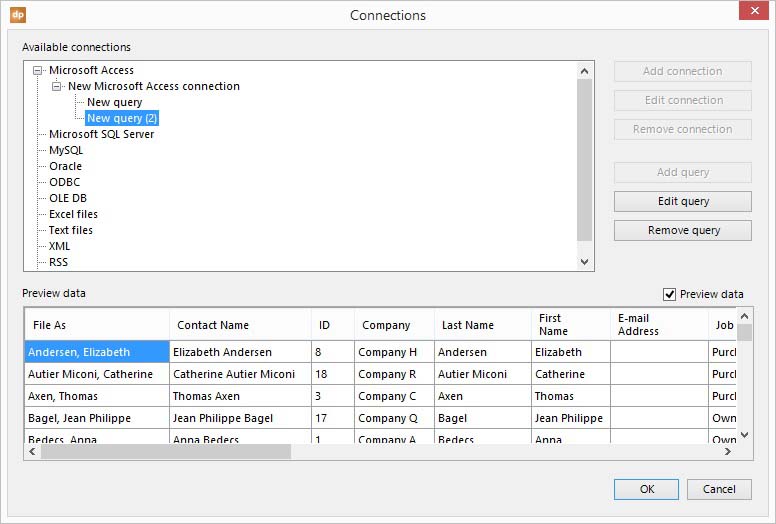
As a database administrator, the user can create queries in the Access database. In the northwind.mdb sample database, there are a few queries already defined. A query is filtering and sorting information of a base table. For example it is filtering out the unpaid invoices. Or it is joining information of two or more data tables when the user needs to display or filter out information of more than one table.

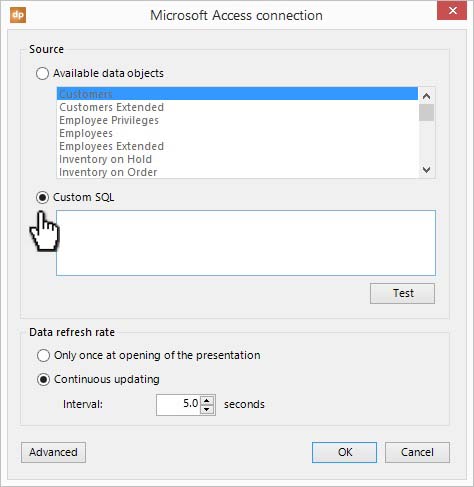
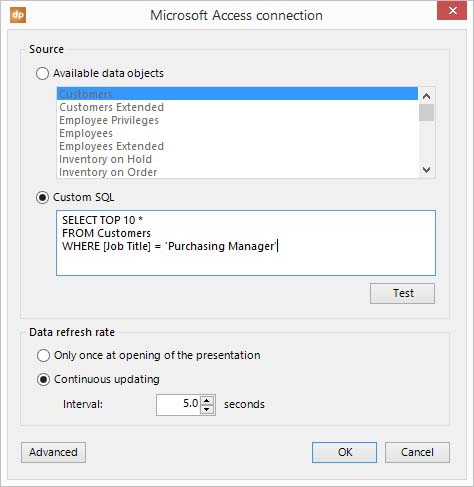
Third method: use custom sql statement
Most flexible is this last option to bind data to the presentation. Again click Add query on the connections list and click the Custom SQL option on the form.
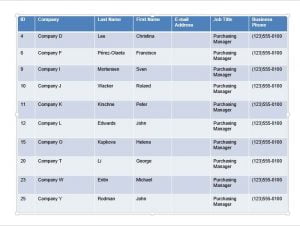 Apply the database data to your shapes
Now the user will know 3 ways to get information of a database in the presentation. The user can now add text boxes and tables and start linking this dynamic database information to the presentation.
Note that with data driven presentations the user will always have the latest information in the presentation, in real-time and without any typing mistakes.
Run this slide show and DataPoint will continuously scan the database for updates and update the default PowerPoint shapes accordingly.
Download DataPoint from the PresentationPoint web site. The NorthWind database is a sample Microsoft Access database provided by Microsoft. The user can download a copy of it.


